


сила сигнала 1 из 5
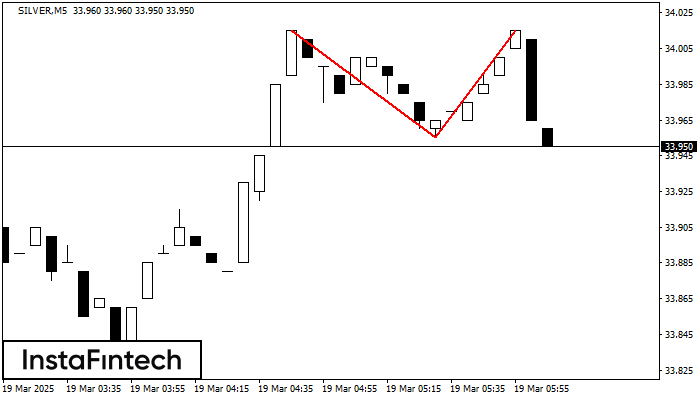
По SILVER на M5 сформировалась разворотная фигура «Двойная вершина». Характеристика: Верхняя граница 34.02; Нижняя граница 33.95; Ширина фигуры 60 пунктов. Позицию на продажу возможно открыть ниже нижней границы 33.95, с перспективой хода к уровню 33.94.
Таймфреймы М5 и М15 могут иметь больше ложных точек входа.
Shuningdek ko'ring
- Все
- Вымпел
- Голова и плечи
- Двойная вершина
- Прямоугольник
- Треугольник
- Тройная вершина
- Флаг
- Все
- #AAPL
- #AMZN
- #Bitcoin
- #EBAY
- #FB
- #GOOG
- #INTC
- #KO
- #MA
- #MCD
- #MSFT
- #NTDOY
- #PEP
- #TSLA
- #TWTR
- AUDCAD
- AUDCHF
- AUDJPY
- AUDUSD
- EURCAD
- EURCHF
- EURGBP
- EURJPY
- EURNZD
- EURRUB
- EURUSD
- GBPAUD
- GBPCHF
- GBPJPY
- GBPUSD
- GOLD
- NZDCAD
- NZDCHF
- NZDJPY
- NZDUSD
- SILVER
- USDCAD
- USDCHF
- USDJPY
- USDRUB
- Все
- M5
- M15
- M30
- H1
- D1
- Все
- Покупка
- Продажа
- Все
- 1
- 2
- 3
- 4
- 5
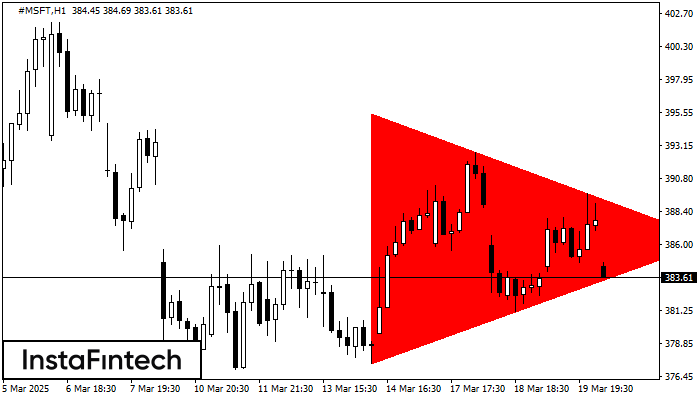
According to the chart of H1, #MSFT formed the Bearish Symmetrical Triangle pattern. Description: The lower border is 377.44/386.30 and upper border is 395.49/386.30. The pattern width is measured
Открыть график инструмента в новом окне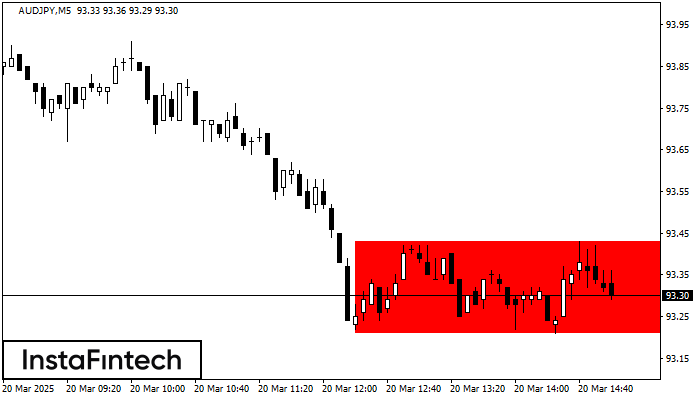
According to the chart of M5, AUDJPY formed the Bearish Rectangle. The pattern indicates a trend continuation. The upper border is 93.43, the lower border is 93.21. The signal means
The M5 and M15 time frames may have more false entry points.
Открыть график инструмента в новом окне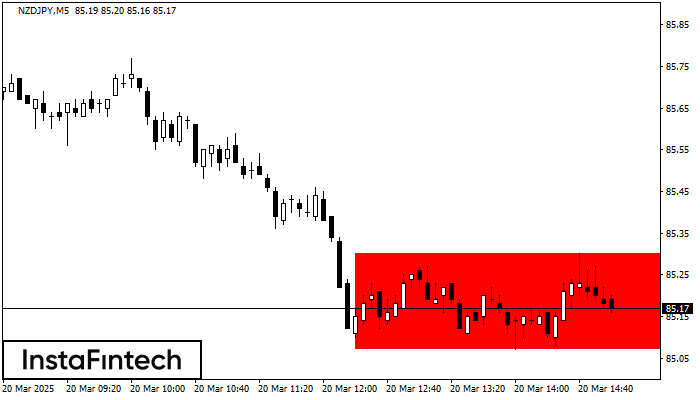
According to the chart of M5, NZDJPY formed the Bearish Rectangle which is a pattern of a trend continuation. The pattern is contained within the following borders: lower border 85.07
The M5 and M15 time frames may have more false entry points.
Открыть график инструмента в новом окне


