signal strength 3 of 5

The Bearish pennant pattern has formed on the NZDUSD M30 chart. It signals potential continuation of the existing trend. Specifications: the pattern’s bottom has the coordinate of 0.5563; the projection of the flagpole height is equal to 29 pips. In case the price breaks out the pattern’s bottom of 0.5563, the downtrend is expected to continue for further level 0.5533.
Vea asimismo
- All
- Double Top
- Flag
- Head and Shoulders
- Pennant
- Rectangle
- Triangle
- Triple top
- All
- #AAPL
- #AMZN
- #Bitcoin
- #EBAY
- #FB
- #GOOG
- #INTC
- #KO
- #MA
- #MCD
- #MSFT
- #NTDOY
- #PEP
- #TSLA
- #TWTR
- AUDCAD
- AUDCHF
- AUDJPY
- AUDUSD
- EURCAD
- EURCHF
- EURGBP
- EURJPY
- EURNZD
- EURRUB
- EURUSD
- GBPAUD
- GBPCHF
- GBPJPY
- GBPUSD
- GOLD
- NZDCAD
- NZDCHF
- NZDJPY
- NZDUSD
- SILVER
- USDCAD
- USDCHF
- USDJPY
- USDRUB
- All
- M5
- M15
- M30
- H1
- D1
- All
- Buy
- Sale
- All
- 1
- 2
- 3
- 4
- 5
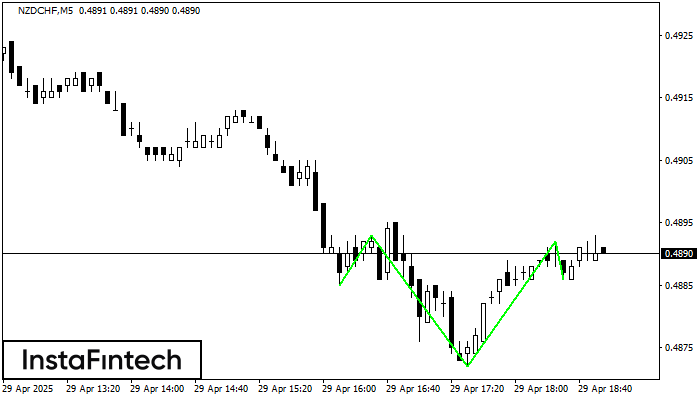
Según el gráfico de M5, NZDCHF formó el patrón Cabeza y Hombros Inverso. El techo de la Cabeza está establecido en 0.4892 mientras la línea media del Cuello se encuentra
Los marcos de tiempo M5 y M15 pueden tener más puntos de entrada falsos.
Open chart in a new window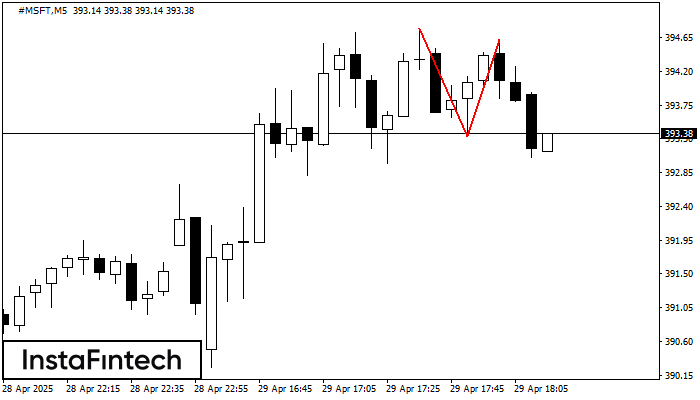
El patrón Doble Techo ha sido formado en #MSFT M5. Esto señala que la tendencia ha sido cambiada de alcista a bajista. Probablemente, si la base del patrón 393.33
Los marcos de tiempo M5 y M15 pueden tener más puntos de entrada falsos.
Open chart in a new window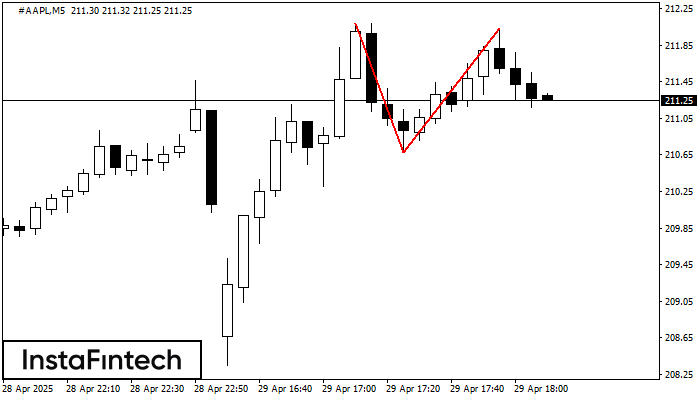
En el gráfico de #AAPL M5 el patrón de reversión Doble Techo ha sido formado. Características: límite superior 212.03; límite inferior 210.68; el ancho del patrón 135 puntos. La señal
Los marcos de tiempo M5 y M15 pueden tener más puntos de entrada falsos.
Open chart in a new window