

signal strength 1 of 5
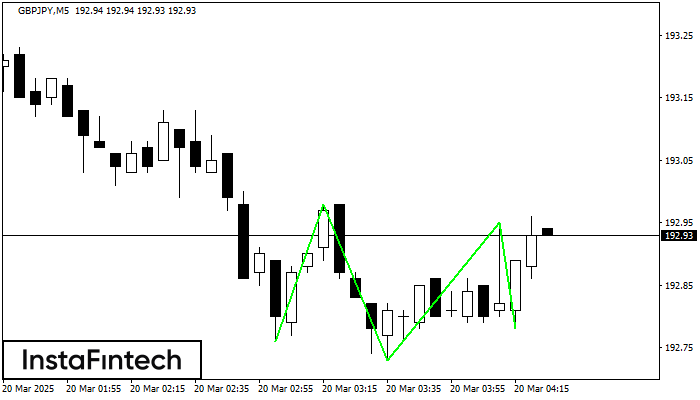
The Triple Bottom pattern has been formed on GBPJPY M5. It has the following characteristics: resistance level 192.98/192.95; support level 192.76/192.78; the width is 22 points. In the event of a breakdown of the resistance level of 192.98, the price is likely to continue an upward movement at least to 192.88.
The M5 and M15 time frames may have more false entry points.
See Also
- All
- Double Top
- Flag
- Head and Shoulders
- Pennant
- Rectangle
- Triangle
- Triple top
- All
- #AAPL
- #AMZN
- #Bitcoin
- #EBAY
- #FB
- #GOOG
- #INTC
- #KO
- #MA
- #MCD
- #MSFT
- #NTDOY
- #PEP
- #TSLA
- #TWTR
- AUDCAD
- AUDCHF
- AUDJPY
- AUDUSD
- EURCAD
- EURCHF
- EURGBP
- EURJPY
- EURNZD
- EURRUB
- EURUSD
- GBPAUD
- GBPCHF
- GBPJPY
- GBPUSD
- GOLD
- NZDCAD
- NZDCHF
- NZDJPY
- NZDUSD
- SILVER
- USDCAD
- USDCHF
- USDJPY
- USDRUB
- All
- M5
- M15
- M30
- H1
- D1
- All
- Buy
- Sale
- All
- 1
- 2
- 3
- 4
- 5

According to the chart of M5, AUDUSD formed the Bullish Symmetrical Triangle pattern. Description: This is the pattern of a trend continuation. 0.6279 and 0.6267 are the coordinates
The M5 and M15 time frames may have more false entry points.
Open chart in a new window
According to the chart of M5, USDCHF formed the Bullish Symmetrical Triangle pattern. The lower border of the pattern touches the coordinates 0.8825/0.8830 whereas the upper border goes across 0.8835/0.8830
The M5 and M15 time frames may have more false entry points.
Open chart in a new window
According to the chart of M15, EURCHF formed the Bearish Rectangle which is a pattern of a trend continuation. The pattern is contained within the following borders: lower border 0.9539
The M5 and M15 time frames may have more false entry points.
Open chart in a new window


