


signal strength 4 of 5
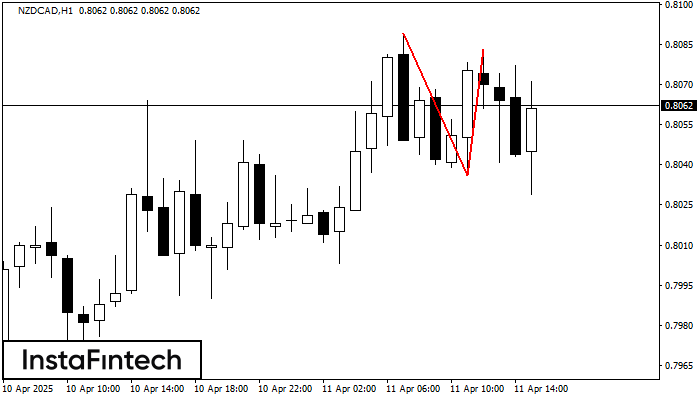
On the chart of NZDCAD H1 the Double Top reversal pattern has been formed. Characteristics: the upper boundary 0.8083; the lower boundary 0.8036; the width of the pattern 47 points. The signal: a break of the lower boundary will cause continuation of the downward trend targeting the 0.7996 level.
- All
- Double Top
- Flag
- Head and Shoulders
- Pennant
- Rectangle
- Triangle
- Triple top
- All
- #AAPL
- #AMZN
- #Bitcoin
- #EBAY
- #FB
- #GOOG
- #INTC
- #KO
- #MA
- #MCD
- #MSFT
- #NTDOY
- #PEP
- #TSLA
- #TWTR
- AUDCAD
- AUDCHF
- AUDJPY
- AUDUSD
- EURCAD
- EURCHF
- EURGBP
- EURJPY
- EURNZD
- EURRUB
- EURUSD
- GBPAUD
- GBPCHF
- GBPJPY
- GBPUSD
- GOLD
- NZDCAD
- NZDCHF
- NZDJPY
- NZDUSD
- SILVER
- USDCAD
- USDCHF
- USDJPY
- USDRUB
- All
- M5
- M15
- M30
- H1
- D1
- All
- Buy
- Sale
- All
- 1
- 2
- 3
- 4
- 5
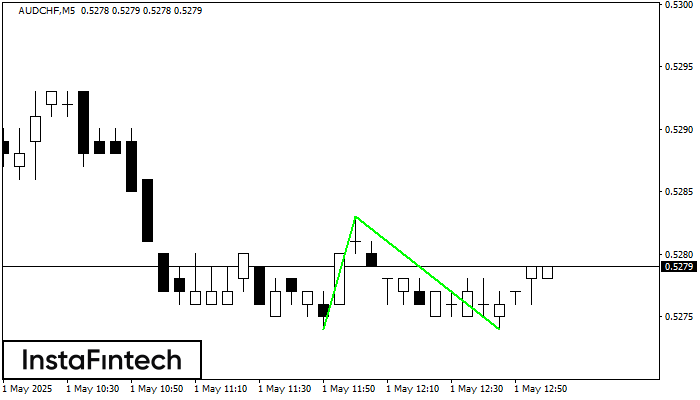
The Double Bottom pattern has been formed on AUDCHF M5; the upper boundary is 0.5283; the lower boundary is 0.5274. The width of the pattern is 9 points. In case
The M5 and M15 time frames may have more false entry points.
Open chart in a new window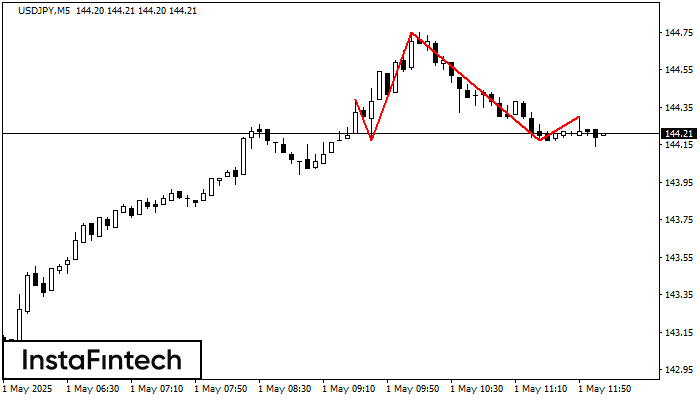
According to the chart of M5, USDJPY formed the Head and Shoulders pattern. The Head’s top is set at 144.75 while the median line of the Neck is found
The M5 and M15 time frames may have more false entry points.
Open chart in a new window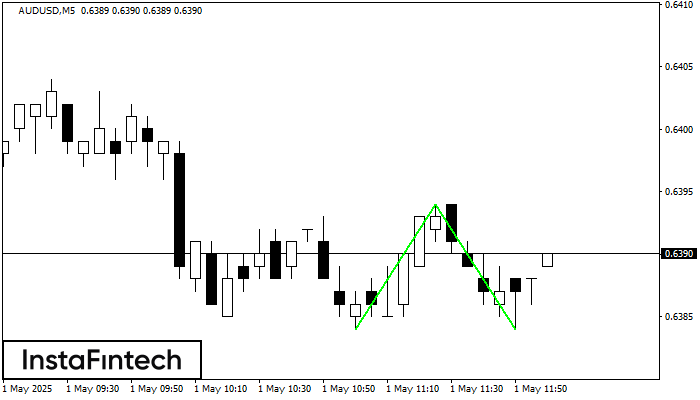
The Double Bottom pattern has been formed on AUDUSD M5; the upper boundary is 0.6394; the lower boundary is 0.6384. The width of the pattern is 10 points. In case
The M5 and M15 time frames may have more false entry points.
Open chart in a new window


