signal strength 2 of 5
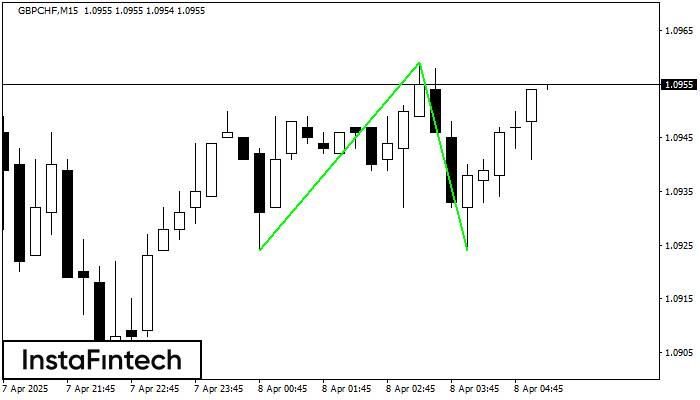
The Double Bottom pattern has been formed on GBPCHF M15. Characteristics: the support level 1.0924; the resistance level 1.0959; the width of the pattern 35 points. If the resistance level is broken, a change in the trend can be predicted with the first target point lying at the distance of 35 points.
The M5 and M15 time frames may have more false entry points.
- All
- Double Top
- Flag
- Head and Shoulders
- Pennant
- Rectangle
- Triangle
- Triple top
- All
- #AAPL
- #AMZN
- #Bitcoin
- #EBAY
- #FB
- #GOOG
- #INTC
- #KO
- #MA
- #MCD
- #MSFT
- #NTDOY
- #PEP
- #TSLA
- #TWTR
- AUDCAD
- AUDCHF
- AUDJPY
- AUDUSD
- EURCAD
- EURCHF
- EURGBP
- EURJPY
- EURNZD
- EURRUB
- EURUSD
- GBPAUD
- GBPCHF
- GBPJPY
- GBPUSD
- GOLD
- NZDCAD
- NZDCHF
- NZDJPY
- NZDUSD
- SILVER
- USDCAD
- USDCHF
- USDJPY
- USDRUB
- All
- M5
- M15
- M30
- H1
- D1
- All
- Buy
- Sale
- All
- 1
- 2
- 3
- 4
- 5

De acordo com o gráfico de M5, #Bitcoin fomrou o padrão de Triângulo Simétrico de Baixa. Este padrão sinaliza uma nova tendência de baixa se o limite inferior 83067.39
Os intervalos M5 e M15 podem ter mais pontos de entrada falsos.
Open chart in a new window
O padrão Bandeira de Alta foi formado em GBPUSD a M15. O limite inferior do padrão está localizado em 1.3255/1.3255, enquanto o limite superior está em 1.3263/1.3263. A projeção
Os intervalos M5 e M15 podem ter mais pontos de entrada falsos.
Open chart in a new window
De acordo com o gráfico de M15, AUDCAD formou o padrão de Triângulo Simétrico de Alta. O limite inferior do padrão toca as coordenadas 0.8813/0.8844 enquanto o limite superior cruza
Os intervalos M5 e M15 podem ter mais pontos de entrada falsos.
Open chart in a new window