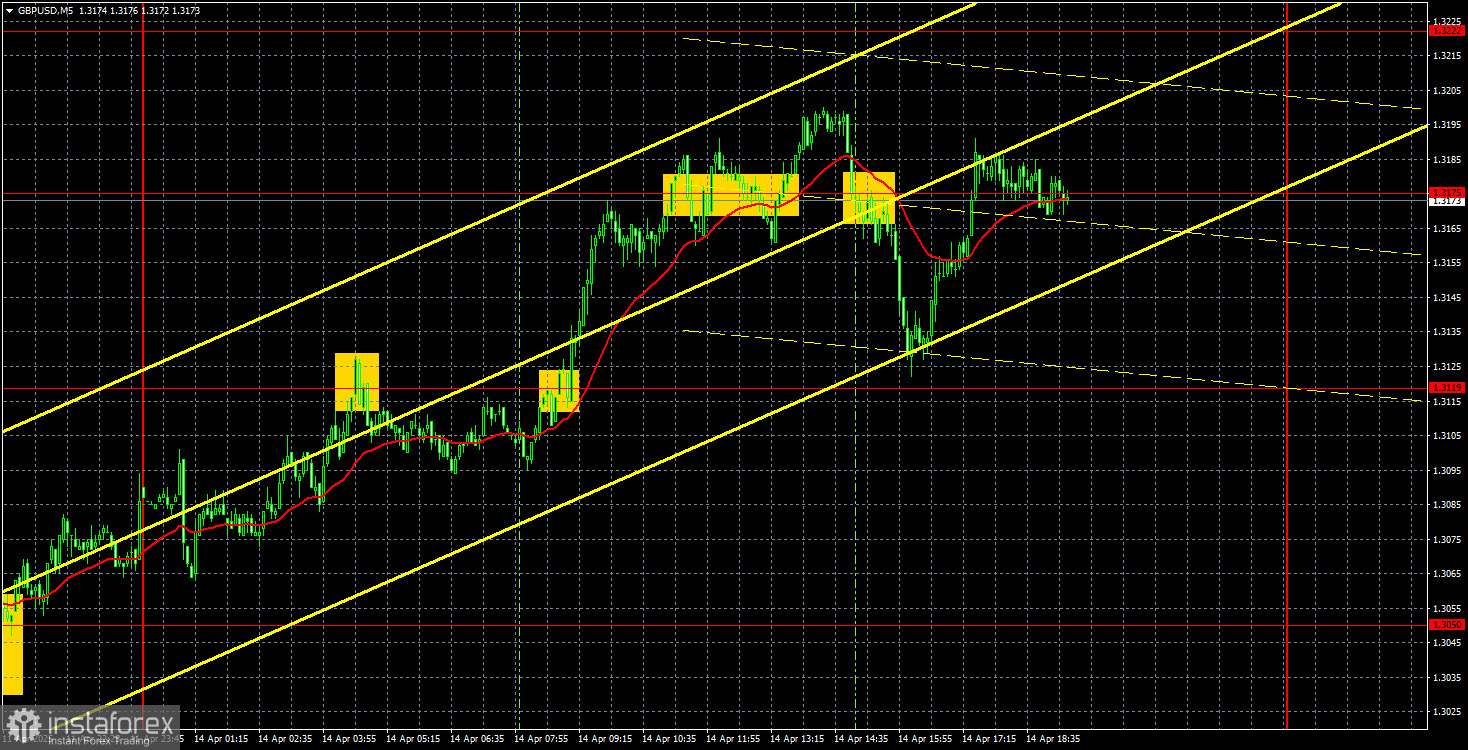
GBP/USD 5-Minute Analysis
The GBP/USD currency pair traded higher on Monday without any "buts." While the euro showed some gains by the end of the day, they weren't significant — in contrast, the British pound spent nearly the entire session moving upward. It's important to note that there were no local macroeconomic or fundamental reasons for this move. The decision was solely based on Donald Trump's choice not to lift tariffs on smartphones and other electronics while instead imposing new tariffs on semiconductors. The movements we observe on the hourly chart are difficult to describe — let alone predict.
This week, there will be very few significant reports in the UK or the US; even those appear to hold little relevance for traders. Once again, all eyes are on Donald Trump. In the hourly timeframe, the pair has been rising steadily for a week with practically no pullbacks — just like it had fallen for a week without any corrections earlier. We still believe that current market movements are as chaotic and erratic as can be.
In the 5-minute timeframe, several signals were generated yesterday; however, it is essential to note that the market is currently exhibiting complete randomness. Occasionally, highly accurate signals emerge, but this is more coincidental than consistent. Usually, price movements are stopped by Ichimoku lines or support/resistance levels. A breakout usually indicates the trader's willingness to drive the pair further in a specific direction. Now, breakouts mean nothing — as clearly shown in the chart above.
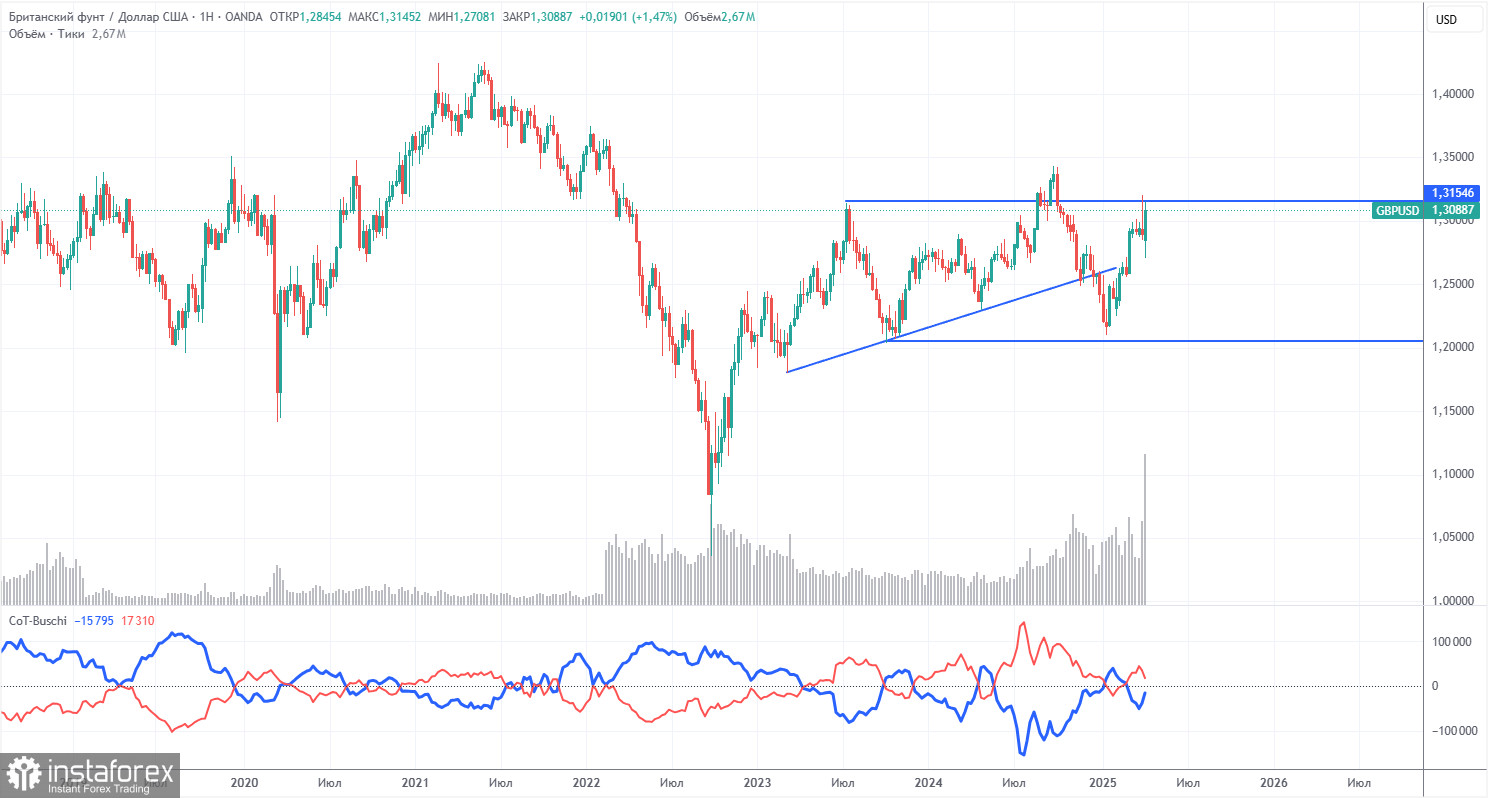
COT Report
COT (Commitments of Traders) reports on the British pound show that commercial traders' sentiment has constantly shifted in recent years. The red and blue lines, representing net positions of commercial and non-commercial traders, frequently cross and often stay close to the zero line. They're also close together, suggesting a roughly equal balance between long and short positions.
On the weekly time frame, the price initially broke through the 1.3154 level, then breached the trendline, returned to 1.3154, and bounced off. Breaking the trendline suggests the pound is likely to continue declining, and the bounce off 1.3154 increases the chances of this bearish scenario. On the weekly chart, everything again points to the pound preparing for a downward move.
According to the latest COT report on the British pound, the "non-commercial" group closed 13,200 BUY contracts and opened 4,000 SELL contracts. This means the net position of non-commercial traders has declined for the second week, this time by 17,200 contracts.
The fundamental backdrop still offers no justification for long-term pound purchases, and the currency remains at real risk of continuing a global downtrend. The pound has gained significantly lately, but the sole reason is Donald Trump's trade policy.
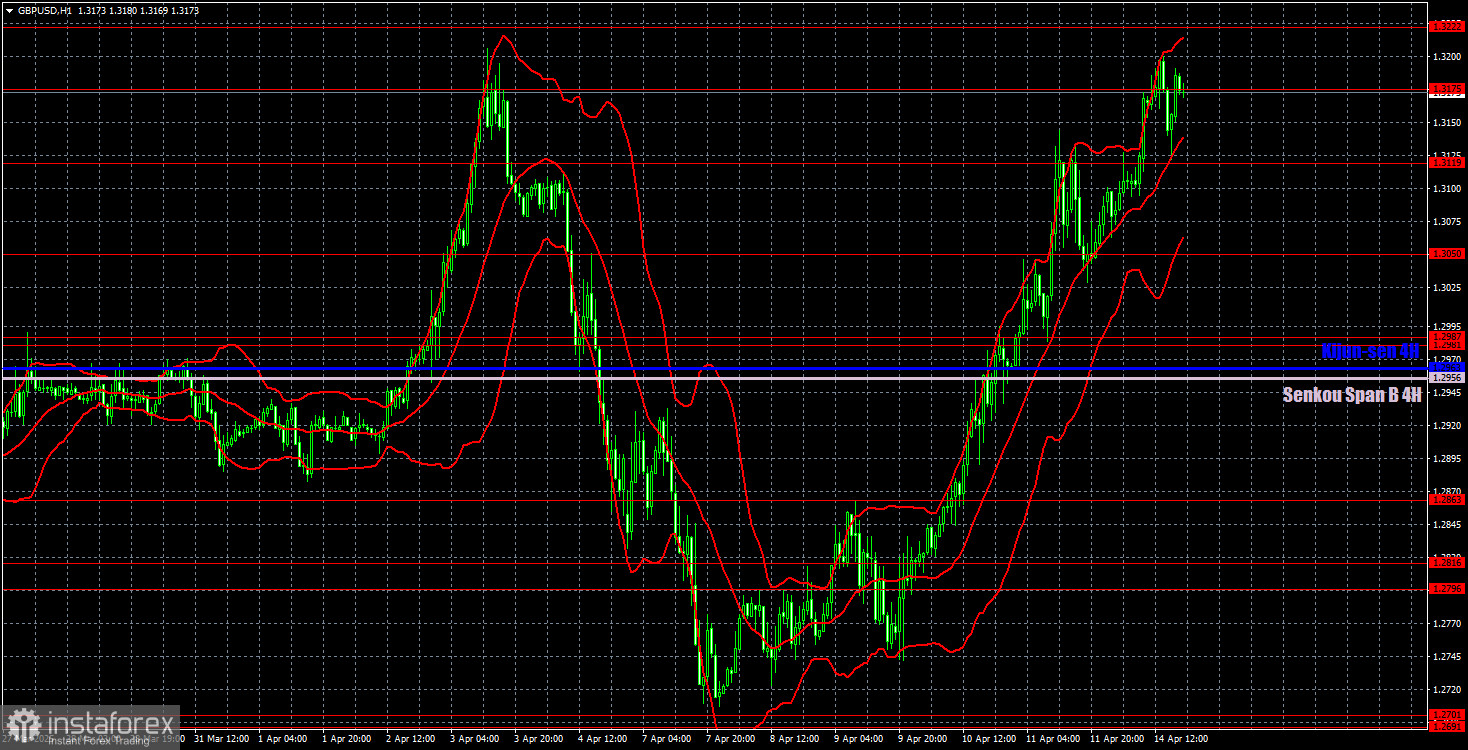
GBP/USD 1-Hour Analysis
In the hourly timeframe, the GBP/USD pair experienced a powerful rally after nearly a month of flat trading, followed by an even stronger drop — and now, another rally. The pound is rising again, though not due to its merit. The upward movement of the pound is a consequence of the dollar's weakness that Donald Trump has driven. And this trend is not over yet. Therefore, the market remains dominated by confusion, chaos, and panic, which must be considered when opening any positions.
For April 15, the following important levels are identified: 1.2511, 1.2605–1.2620, 1.2691–1.2701, 1.2796–1.2816, 1.2863, 1.2981–1.2987, 1.3050, 1.3119, 1.3175, 1.3222, 1.3273, 1.3358. The Senkou Span B line at 1.2956 and Kijun-sen at 1.2963 may also serve as sources of signals. Setting the Stop Loss to breakeven once the price moves 20 pips in the right direction is recommended. Note that the Ichimoku lines can shift throughout the day and should be considered when identifying signals.
On Tuesday, the UK will publish reports on unemployment, claimant count change, and wages. The logic here is straightforward: if the figures exceed forecasts, the British pound will likely continue its rise. If they fall short, one shouldn't expect a sharp rally in the U.S. dollar either. And, of course, we mustn't forget that Trump never sleeps — and he's ready to impose new sanctions and tariffs around the clock. As for the U.S., no scheduled economic events are on the calendar.
Illustration Explanations:
- Support and Resistance Levels (thick red lines): Thick red lines indicate where movement may come to an end. Please note that these lines are not sources of trading signals.
- Kijun-sen and Senkou Span B Lines: Ichimoku indicator lines transferred from the 4-hour timeframe to the hourly timeframe. These are strong lines.
- Extreme Levels (thin red lines): Thin red lines where the price has previously bounced. These serve as sources of trading signals.
- Yellow Lines: Trendlines, trend channels, or any other technical patterns.
- Indicator 1 on COT Charts: Represents the net position size for each category of traders.