On Monday, the GBP/USD currency pair again showed upward movement. The pound sterling began rising overnight despite no clear reasons or fundamental drivers. Yet the market on Monday clearly demonstrated that it remains biased toward buying the pound—or rather, selling the dollar.
At present, the correlation between the euro and the pound is relatively low. Both European currencies are rising, but the pound is rising more strongly and correcting less. It's almost as if we're comparing Bitcoin and Ethereum. The Federal Reserve's monetary policy no longer seems relevant to the market because of Donald Trump's trade policy. Meanwhile, the eurozone and the UK don't have such a disruptive factor, so the market still pays attention to the monetary policies of the European Central Bank and the Bank of England.
What is the monetary policy stance of European central banks? The ECB is continuing its easing measures and has officially stated that inflation is close to the target, while GDP figures are raising concerns. As a result, the ECB is lowering rates—not because inflation needs to be fought, but because the economy needs stimulus. In the UK, the situation is the opposite. Inflation has been rising recently, and Andrew Bailey has suggested it could reach as high as 4% soon. The Bank of England is unwilling to tolerate high inflation and believes the economy can wait.
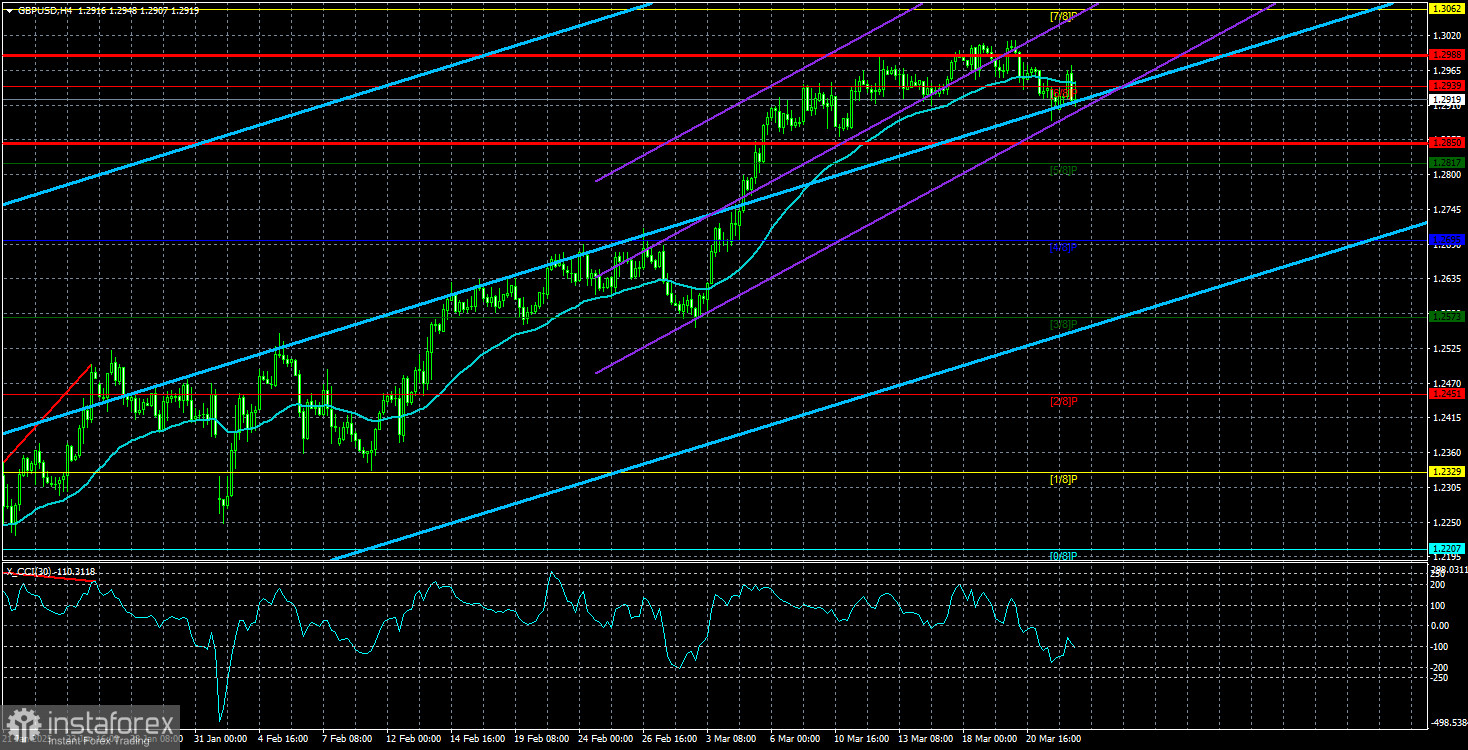
Therefore, the British central bank is in no rush to lower its key rate, which supports the pound sterling—a form of support the euro lacks. From a technical standpoint, the GBP/USD pair clearly shows an upward trend in the H4 timeframe. At the same time, a downward trend is still visible on the daily and monthly timeframes. One might assume we're at an inflection point—where both long-term trends may end. But that would imply the dollar is now set for a prolonged decline. Can Donald Trump continuously suppress demand for the U.S. dollar while also wanting it to remain the "world's reserve currency"?
Understanding what Trump wants is extremely difficult. Some of his goals contradict one another, and some defy logic and common sense. Forecasting Trump's next moves is like trying to predict the flight paths of seagulls over the sea. So, all that's left is to rely on raw technical analysis—since the market is paying attention to nothing but Trump and his decisions.
But if we try to look beyond the Trump narrative, we still believe the dollar has become far too cheap. Trump hasn't yet caused severe damage to the U.S. economy, yet the dollar has plummeted as if a recession were already at the doorstep.
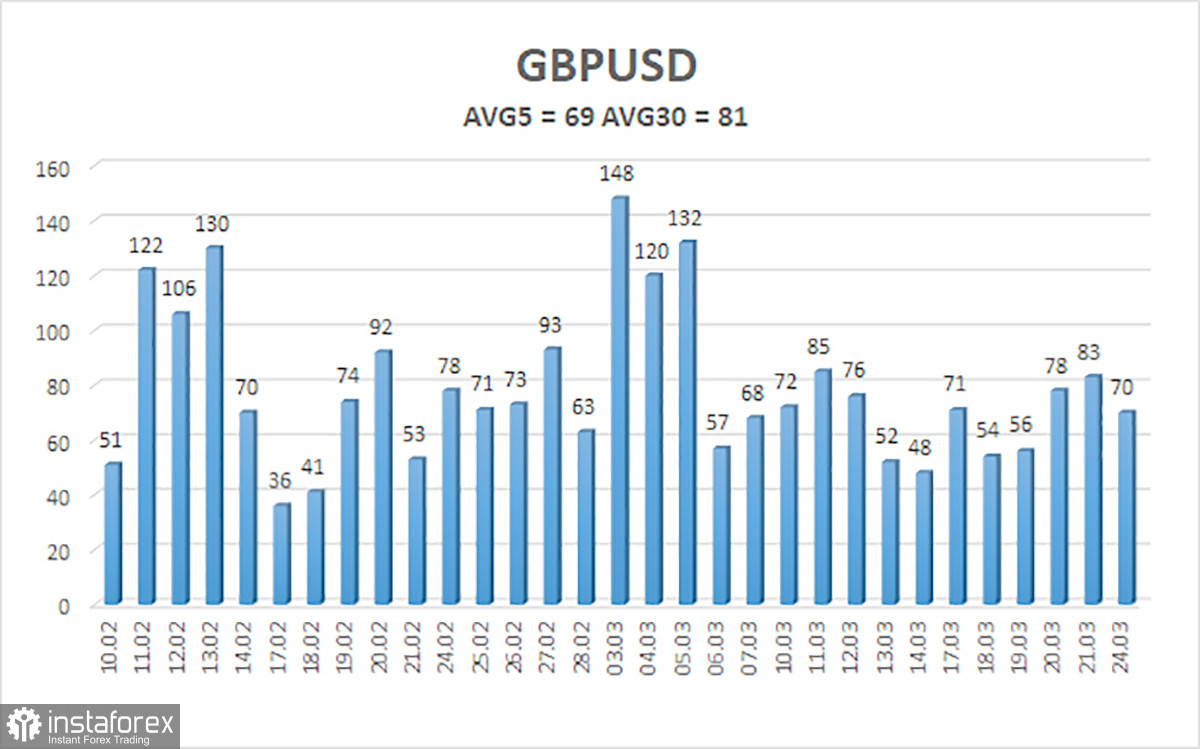
The average volatility of the GBP/USD pair over the last five trading days is 69 pips, which is considered "moderate-low" for this currency pair. On Tuesday, March 25, we expect the pair to trade within a range of 1.2850 and 1.2988. The long-term regression channel has turned upward, but the downtrend remains intact on the daily timeframe. The CCI indicator has not recently entered overbought or oversold territory.
Nearest Support Levels:
S1 – 1.2817
S2 – 1.2695
S3 – 1.2573
Nearest Resistance Levels:
R1 – 1.2939
R2 – 1.3062
R3 – 1.3184
Trading Recommendations:
The GBP/USD currency pair maintains its medium-term downtrend, while a weak correction has begun on the H4 timeframe. We still do not consider long positions, as we believe the current upward move is simply a corrective rally that has taken on an irrational, panic-driven character. However, if you trade based solely on technicals, long positions are relevant with targets at 1.2988 and 1.3062 as long as the price remains above the moving average. Short positions remain attractive with targets at 1.2207 and 1.2146 because the upward correction on the daily timeframe will end sooner or later—unless the prior downtrend is entirely reversed. The pound sterling appears extremely overbought and unjustifiably expensive, and Donald Trump won't be able to devalue the dollar indefinitely. However, predicting how long this "Trump-driven" dollar drop will continue is extremely difficult.
Explanation of Illustrations:
Linear Regression Channels help determine the current trend. If both channels are aligned, it indicates a strong trend.
Moving Average Line (settings: 20,0, smoothed) defines the short-term trend and guides the trading direction.
Murray Levels act as target levels for movements and corrections.
Volatility Levels (red lines) represent the likely price range for the pair over the next 24 hours based on current volatility readings.
CCI Indicator: If it enters the oversold region (below -250) or overbought region (above +250), it signals an impending trend reversal in the opposite direction.