Hello, dear colleagues.
For the Euro/Dollar pair, the subsequent development of the downward cycle from March 9 is expected after the breakdown of 1.1065. For the Pound/Dollar pair, we follow the development of the downward cycle from March 9 and the continuation of the downward movement is expected after the price passes the range of 1.2448-1.2384. For the Dollar/Franc pair, we follow the upward structure from March 9 and the level of 0.9570 is the key resistance. For the Dollar/Yen pair, we follow the upward structure from March 9; the level of 108.00 is the key resistance and the level of 105.97 is the key support. For the Euro/Yen pair, the price forms local initial conditions for the top of March 12 and the level of 119.85 is the key resistance. For the Pound/Yen pair, the price forms small initial conditions for the top of March 13 and the level of 132.33 is the key support.
Forecast for March 13:
Analytical review of currency pairs on the H1 scale:
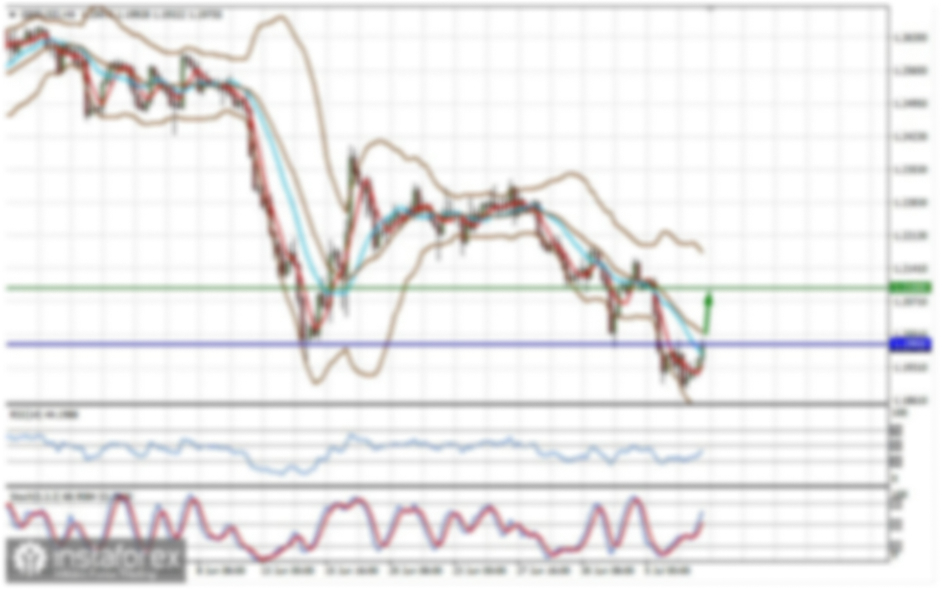
For the Euro/Dollar pair, the key levels on the H1 scale are: 1.1259, 1.1207, 1.1166, 1.114, 1.1065, 1.0988, 1.0942, and 1.0851. Here, we follow the development of the downward cycle from March 9. A short-term downward movement, as well as consolidation, is expected in the range of 1.1114-1.1065 and the breakdown of the last value will lead to a pronounced downward movement. Here, the target is 1.0988 and in the area of 1.0988-1.0942 is the price consolidation. We consider the level of 1.0851 as a potential value for the bottom, upon reaching this value, we expect a rollback to the top.
A short-term upward movement is expected in the range of 1.1166-1.1207 and the breakdown of the last value will lead to an in-depth correction. Here, the target is 1.1259 and this level is the key support for the downward structure.
The main trend is the downward cycle from March 9.
Trading recommendations:
Buy: 1.1166 Take profit: 1.1205
Buy: 1.1208 Take profit: 1.1257
Sell: 1.1065 Take profit: 1.0990
Sell: 1.0986 Take profit: 1.0943
For the Pound/Dollar pair, the key levels on the H1 scale are: 1.2739, 1.2611, 1.2543, 1.2448, 1.2384, and 1.227. Here, we follow the development of the downward cycle from March 9. A short-term downward movement is expected in the area of 1.2448-1.2384 and the breakdown of the last value will lead to a pronounced movement. Here, the target is 1.2227 and we expect a pullback to the top from this level.
A short-term upward movement is possible in the area of 1.2543-1.2611 and the breakdown of the last value will lead to an in-depth correction. Here, the target is 1.2739 and this level is the key support for the descending structure.
The main trend is the downward cycle from March 9.
Trading recommendations:
Buy: 1.2543 Take profit: 1.2610
Buy: 1.2614 Take profit: 1.2737
Sell: 1.2448 Take profit: 1.2385
Sell: 1.2382 Take profit: 1.2230
For the Dollar/Franc pair, the key levels on the H1 scale are: 0.9686, 0.9641, 0.9570, 0.9518, 0.9444, 0.9411, and 0.9355. Here, we follow the development of the upward cycle from March 9. A short-term upward movement, as well as consolidation, is expected in the area of 0.9518-0.9570 and the breakdown of the last value should be accompanied by a pronounced upward movement. Here, the target is 0.9641. We consider the level 0.9686 as a potential value for the top, after reaching which we expect consolidation, as well as a pullback to the bottom.
A short-term downward movement is possible in the area of 0.9444-0.9411 and the breakdown of the last value will lead to an in-depth correction. Here, the target is 0.9355 and this level is the key support for the top.
The main trend is the initial conditions for the top from March 9.
Trading recommendations:
Buy: 0.9520 Take profit: 0.9568
Buy: 0.9572 Take profit: 0.9640
Sell: 0.9444 Take profit: 0.9412
Sell: 0.9408 Take profit: 0.9360
For the Dollar/Yen pair, the key levels in the H1 scale are: 111.11, 110.31, 108.96, 108.00, 106.60, 105.97, and 105.02. Here, we follow the development of the upward cycle from March 9. We expect the continuation of the upward movement after the breakdown of 108.00. In this case, the target is 108.96 and consolidation is near this level. A break of 108.96 will lead to the development of a pronounced movement. Here, the target is 110.31. We consider the level of 111.11 to be a potential value for the top, upon reaching this value we expect consolidation, as well as a pullback to the bottom.
A short-term downward movement is possible in the area of 106.60-105.97 and the breakdown of the last value will lead to an in-depth correction. Here, the target is 105.02 and this level is the key support for the top.
The main trend is the upward cycle from March 9.
Trading recommendations:
Buy: 108.00 Take profit: 108.92
Buy: 108.98 Take profit: 110.30
Sell: 106.60 Take profit: 106.00
Sell: 105.95 Take profit: 105.08
For the Canadian dollar/Dollar pair, the key levels on the H1 scale are: 1.4092, 1.4011, 1.3970, 1.3905, 1.3848, 1.3752, 1.3699, 1.3634, and 1.3519. Here, we follow the development of the local ascending structure from March 9. A short-term upward movement is expected in the area of 1.3848-1.3905 and the breakdown of the last value will lead to a pronounced movement. Here, the target is 1.3970 and in the area of 1.3970-1.4011 is the price consolidation. We consider the level of 1.4092 as a potential value for the top, upon reaching which, we expect consolidation, as well as a pullback to the bottom.
A short-term downward movement is possible in the area of 1.3752-1.3699 and the breakdown of the last value will lead to an in-depth correction. Here, the target is 1.3634 and this level is the key support for the top.
The main trend is the local upward structure from March 9.
Trading recommendations:
Buy: 1.3848 Take profit: 1.3905
Buy: 1.3907 Take profit: 1.3970
Sell: 1.3752 Take profit: 1.3700
Sell: 1.3696 Take profit: 1.3636
For the Australian dollar/Dollar pair, the key levels on the H1 scale are: 0.6459, 0.6373, 0.6326, 0.6229, 0.6149, and 0.6098. Here, we follow the development of the downward cycle from March 9. We expect the continuation of the downward movement after the breakdown of 0.6229. In this case, the target is 0.6149. We consider the level of 0.6098 as a potential value for the bottom, after reaching this level we expect consolidation, as well as a possible pullback to the top.
A short-term upward movement is possible in the area of 0.6326-0.6373 and the breakdown of the last value will lead to an in-depth correction. Here, the target is 0.6459 and this level is the key support for the descending structure.
The main trend is the downward structure from March 9.
Trading recommendations:
Buy: 0.6326 Take profit: 0.6371
Buy: 0.6380 Take profit: 0.6458
Sell: 0.6229 Take profit: 0.6150
Sell: 0.6146 Take profit: 0.6100
For the Euro/Yen pair, the key levels on the H1 scale are: 123.12, 122.21, 120.93, 119.85, 118.42, 117.92, 116.27, and 117.11. Here, we are waiting for the local initial conditions for the top from March 12. We expect the continuation of the upward movement after the breakdown of 119.85. In this case, the target is 120.93 and consolidation is near this level. A breakdown of the level of 120.95 will lead to the development of a pronounced movement. In this case, the target is 122.21. We consider the level of 123.12 as a potential value for the top, upon reaching this value, we expect a pullback to the bottom.
A short-term downward movement is possible in the range of 118.42-117.92 and the breakdown of the last value will lead to an in-depth correction. Here, the target is 117.11 and this level is the key support for the upward structure. Its passage at the price will lead to the movement to the first potential target of 116.27.
The main trend is the formation of local initial conditions for the upward cycle from March 12.
Trading recommendations:
Buy: 119.85 Take profit: 120.90
Buy: 120.95 Take profit: 122.20
Sell: 118.40 Take profit: 117.95
Sell: 117.88 Take profit: 117.20
For the Pound/Yen pair, the key levels on the H1 scale are: 137.47, 136.64, 135.42, 134.49, 133.07, 132.33, 131.18, and 129.61. Here, the price forms a small potential for an upward cycle from March 13. A short-term upward movement is expected in the area of 134.49-135.42 and the breakdown of the last value will lead to a pronounced movement. Here, the target is 136.64. We consider the level of 137.47 as a potential value for the top, after reaching which we expect consolidation, as well as a pullback to the bottom.
A short-term downward movement is possible in the area of 133.07-132.33, hence the probability of a reversal to the top is high. The breakdown of the level of 132.30 will lead to the development of a downward trend. Here, the target is 131.18 and this level is the key resistance for the subsequent development of a downward structure. We consider the level of 129.61 as a potential value for the downward trend.
The main trend is the formation of a local structure from March 13.
Trading recommendations:
Buy: 134.50 Take profit: 135.40
Buy: 135.60 Take profit: 136.60
Sell: 133.05 Take profit: 132.40
Sell: 132.30 Take profit: 131.20