Hello, dear colleagues.
For the Euro/Dollar pair, the price forms the initial conditions for the top of July 9 and the development of this structure is expected after the breakdown of 1.1291. For the Pound/Dollar pair, we follow the upward structure from July 10 and the level of 1.2514 is the key support. For the Dollar/Franc pair, we follow the development of the downward structure from July 9 and we expect the continuation of the downward movement after the breakdown of 0.9841. For the Dollar/Yen pair, the price forms a pronounced potential for a downward movement from July 10. For the Euro/Yen pair, the price went into a state of equilibrium in connection with the formation of the medium-term falling structure from July 1. For the Pound/Yen pair, the price is in correction and the level of 136.31 is the key support, the downward movement is expected after the breakdown of 134.99.
Forecast for July 11:
Analytical review of the currency pairs in H1 scale:
For the Euro/Dollar pair, the key levels on the H1 scale are: 1.1363, 1.1336, 1.1317, 1.1291, 1.1257, 1.1240, 1.1218, 1.1191 and 1.1155. The price forms an upward structure from July 9. We expect the upward movement to continue after the breakdown of 1.1291. In this case, the target is 1.1317 and in the area of 1.1317 – 1.1336 is the short-term upward movement, as well as consolidation. The potential value for the top is considered the level of 1.1363, upon reaching which we expect a rollback downwards.
The short-term downward movement is possible in the area of 1.1257 – 1.1240 and the breakdown of the last value will lead to an in-depth correction. The goal is 1.1218 and this level is the key support for the downward structure. Its breakdown will allow counting on the movement to the level of 1.1191.
The main trend is the formation of the upward structure of July 9.
Trading recommendations:
Buy 1.1291 Take profit: 1.1317
Buy 1.1336 Take profit: 1.1360
Sell: 1.1256 Take profit: 1.1241
Sell: 1.1238 Take profit: 1.1218
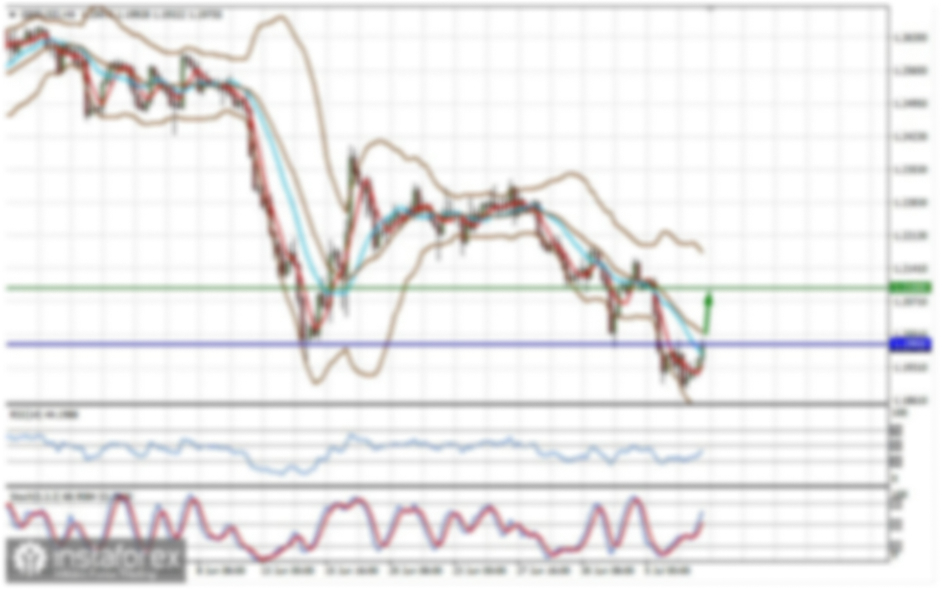
For the Pound/Dollar pair, the key levels on the H1 scale are: 1.2652, 1.2633, 1.2603, 1.2580, 1.2539, 1.2514, 1.2480 and 1.2438. We follow the development of the upward structure of July 10. The short-term upward movement is possible in the area of 1.2580 – 1.2603 and the breakdown of the last value should be accompanied by a pronounced upward movement. The goal is 1.2633. The potential value for the top is the level of 1.2652, upon reaching which we expect consolidation, as well as a rollback to the bottom.
The short-term downward movement is expected in the area of 1.2539 – 1.2514 and the breakdown of the last value will lead to a protracted correction. The goal is 1.2480 and this level is the key support for the upward structure.
The main trend is the upward structure of July 10.
Trading recommendations:
Buy: 1.2580 Take profit: 1.2602
Buy: 1.2604 Take profit: 1.2633
Sell: 1.2539 Take profit: 1.2515
Sell: 1.2512 Take profit: 1.2482
For the Dollar/Franc pair, the key levels on the H1 scale are: 0.9952, 0.9902, 0.9881, 0.9841, 0.9820, 0.9797 and 0.9779. The price is forming a downward structure from July 9. The continuation of the downward movement is expected after the breakdown of 0.9841. In this case, the target is 0.9820 and the breakdown of which, in turn, will allow us to count on the movement to 0.9797. The potential value for the downward trend is still the level of 0.9779, upon reaching this level, we expect a rollback to the correction.
The short-term upward movement is possible in the area of 0.9905 – 0.9881 and the breakdown of the last value will have to form the initial conditions for the upward cycle. The potential target is 0.9952.
The main trend is the formation of the downward structure of July 9.
Trading recommendations:
Buy: 0.9881 Take profit: 0.9900
Buy: 0.9910 Take profit: 0.9950
Sell: 0.9840 Take profit: 0.9822
Sell: 0.9818 Take profit: 0.9797
For the Dollar/Yen pair, the key levels in the scale are: 108.99, 108.70, 108.42, 108.26, 107.78, 107.58, 107.41, 106.98 and 106.68. We follow the downward structure of July 10. We expect the continuation of the downward movement after the breakdown of 107.78. The target is 107.58, near this level is the price consolidation. The passage of the price of the range of 107.58 – 107.41 will lead to the development of a pronounced movement. In this case, the goal is 106.98. The potential value for the bottom is the level of 106.68, from which we expect a rollback up.
The short-term upward movement is possible in the area of 108.26 – 108.42 and the breakdown of the last value will lead to a protracted correction. The target is 108.70 and this level is the key support for the top.
The main trend is the formation of the downward structure of July 10.
Trading recommendations:
Buy: 108.26 Take profit: 108.40
Buy: 108.43 Take profit: 108.70
Sell: 107.78 Take profit: 107.58
Sell: 107.40 Take profit: 107.00
For the Canadian Dollar/Dollar pair, the key levels on the H1 scale are: 1.3105, 1.3079, 1.3063, 1.3039, 1.3015, 1.2995 and 1.2970. We follow the formation of the downward structure of July 9. We expect the continuation of the downward movement after the breakdown of 1.3039. In this case, the target is 1.3015 and in the area of 1.3015 – 1.2995 is the short-term downward movement, as well as consolidation. The potential value for the bottom is considered the level of 1.2970, at which the expected roll back up.
The short-term upward movement is possible in the area of 1.3063 – 1.3079 and the breakdown of the last value will lead to an in-depth correction. The target is 1.3105 and this level is the key support for the downward structure of July 9.
The main trend is the formation of the potential for the downward movement of July 9.
Trading recommendations:
Buy: 1.3063 Take profit: 1.3078
Buy: 1.3081 Take profit: 1.3105
Sell: 1.3039 Take profit: 1.3015
Sell: 1.3013 Take profit: 1.2995
For the Australian Dollar/Dollar pair, the key levels on the H1 scale are: 0.7050, 0.7028, 0.7014, 0.6991, 0.6964, 0.6950, 0.6929 and 0.6900. We follow the formation of the initial conditions for the upward cycle of July 10. We expect the upward movement to continue after the breakdown of 0.6991. In this case, the target is 0.7014 and in the area of 0.7014 – 0.7028 is the short-term upward movement, as well as consolidation. The potential value for the top is the level of 0.7050.
The short-term downward movement is possible in the area of 0.6964 – 0.6950 and the breakdown of the last value will lead to an in-depth correction. The target is 0.6929 and this level is the key support for the upward structure.
The main trend is the formation of the upward structure of July 10.
Trading recommendations:
Buy: 0.6991 Take profit: 0.7014
Buy: 0.7015 Take profit: 0.7026
Sell: 0.6964 Take profit: 0.6952
Sell: 0.6948 Take profit: 0.6930
For the Euro/Yen pair, the key levels on the H1 scale are: 122.28, 121.89, 121.67, 121.41, 121.22, 120.92 and 120.48. the price entered the equilibrium state: the medium-term downward structure of July 1. We expect the movement to continue downwards after the price passes the range of 121.41 – 121.22. In this case, the target is 120.92 and near this level is the consolidation. The potential value for the bottom is considered the level of 120.48, after reaching which we expect a rollback to the top.
The consolidated movement is possible in the area of 121.89 – 122.28 and the level of 122.28 is the key support for the downward structure. Its price passage will have to form the initial conditions for the upward cycle.
The main trend is the medium-term downward structure of July 1, the equilibrium state.
Trading recommendations:
Buy: Take profit:
Buy: 121.94 Take profit: 122.28
Sell: 121.22 Take profit: 120.94
Sell: 120.90 Take profit: 120.50
For the Pound/Yen pair, the key levels on the H1 scale are: 136.31, 135.87, 135.65, 135.24, 134.99 and 134.50. We continue to monitor the downward cycle from July 1. At the moment, the price is in the correction zone. The short-term downward movement is expected in the range of 135.24 – 134.99 and the breakdown of the last value will allow us to count on the movement to the potential target – 134.50, upon reaching this level, we expect a rollback upwards.
The short-term upward movement is possible in the range of 135.87 – 136.31, to the level of 136.31, we expect the formation of the potential for the upward cycle.
The main trend is the downward cycle of July 1, the stage of correction.
Trading recommendations:
Buy: Take profit:
Buy: 135.90 Take profit: 136.30
Sell: 135.24 Take profit: 135.00
Sell: 134.95 Take profit: 134.50