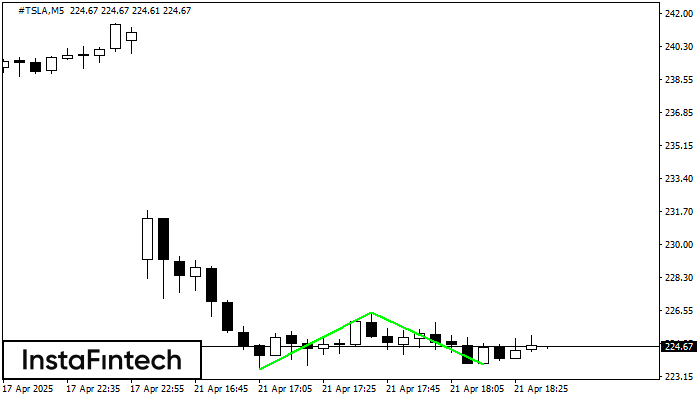
was formed on 21.04 at 17:34:33 (UTC+0)
signal strength 1 of 5
signal strength 1 of 5

The Double Bottom pattern has been formed on #TSLA M5; the upper boundary is 226.48; the lower boundary is 223.73. The width of the pattern is 301 points. In case of a break of the upper boundary 226.48, a change in the trend can be predicted where the width of the pattern will coincide with the distance to a possible take profit level.
The M5 and M15 time frames may have more false entry points.
Figure
Instrument
Timeframe
Trend
Signal Strength


