signal strength 1 of 5
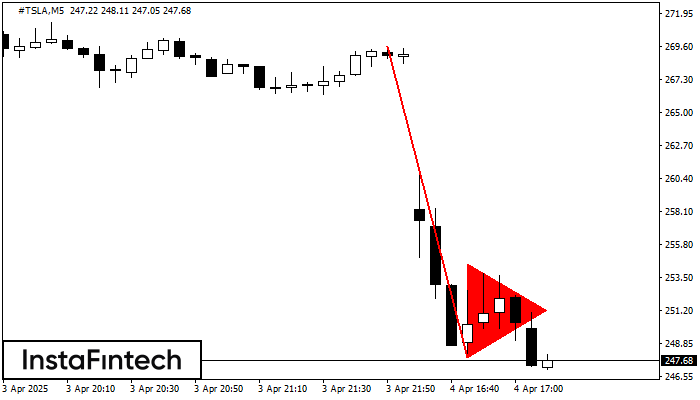
The Bearish pennant pattern has formed on the #TSLA M5 chart. It signals potential continuation of the existing trend. Specifications: the pattern’s bottom has the coordinate of 247.91; the projection of the flagpole height is equal to 2171 pips. In case the price breaks out the pattern’s bottom of 247.91, the downtrend is expected to continue for further level 247.76.
The M5 and M15 time frames may have more false entry points.
- All
- Double Top
- Flag
- Head and Shoulders
- Pennant
- Rectangle
- Triangle
- Triple top
- All
- #AAPL
- #AMZN
- #Bitcoin
- #EBAY
- #FB
- #GOOG
- #INTC
- #KO
- #MA
- #MCD
- #MSFT
- #NTDOY
- #PEP
- #TSLA
- #TWTR
- AUDCAD
- AUDCHF
- AUDJPY
- AUDUSD
- EURCAD
- EURCHF
- EURGBP
- EURJPY
- EURNZD
- EURRUB
- EURUSD
- GBPAUD
- GBPCHF
- GBPJPY
- GBPUSD
- GOLD
- NZDCAD
- NZDCHF
- NZDJPY
- NZDUSD
- SILVER
- USDCAD
- USDCHF
- USDJPY
- USDRUB
- All
- M5
- M15
- M30
- H1
- D1
- All
- Buy
- Sale
- All
- 1
- 2
- 3
- 4
- 5
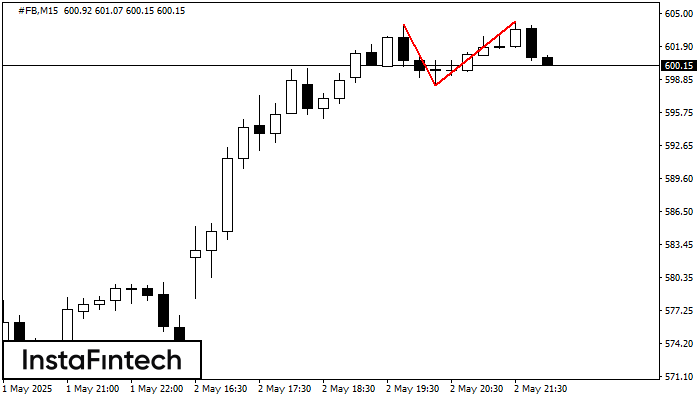
Corak Double Top telah dibentuk pada #FB M15. Isyarat bahawa aliran telah berubah dari aliran menaik ke aliran menurun. Mungkin, sekiranya asas corak 598.31 ditembusi, pergerakan menurun akan berterusan
Carta masa M5 dan M15 mungkin mempunyai lebih banyak titik kemasukan palsu.
Open chart in a new window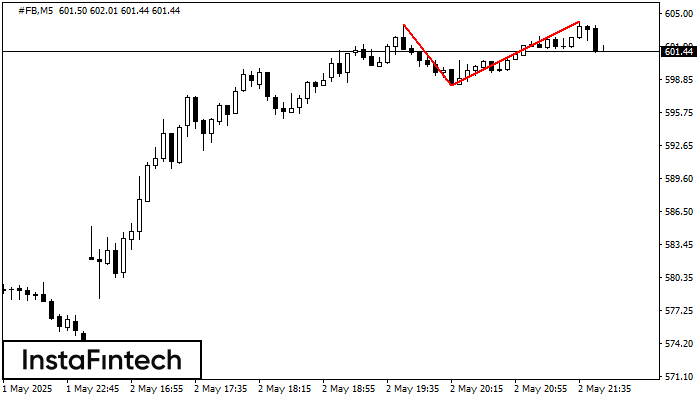
Corak pembalikan Double Top telah dibentuk pada #FB M5. Ciri-ciri: sempadan atas %P0.000000; sempadan bawah 604.00; sempadan bawah 598.31; lebar corak adalah 594 mata. Dagangan menjual adalah lebih baik untuk
Carta masa M5 dan M15 mungkin mempunyai lebih banyak titik kemasukan palsu.
Open chart in a new window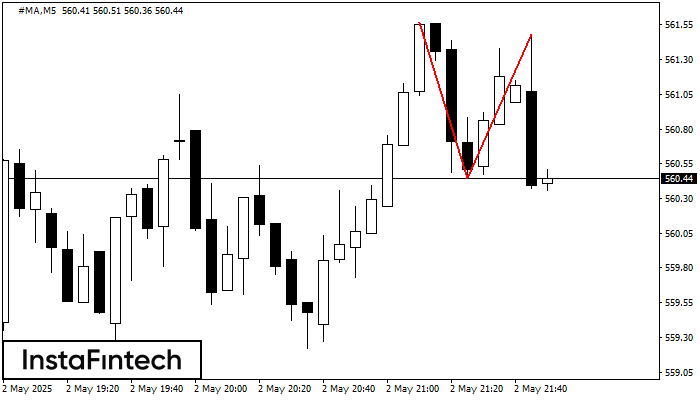
Corak pembalikan Double Top telah dibentuk pada #MA M5. Ciri-ciri: sempadan atas %P0.000000; sempadan bawah 561.57; sempadan bawah 560.44; lebar corak adalah 104 mata. Dagangan menjual adalah lebih baik untuk
Carta masa M5 dan M15 mungkin mempunyai lebih banyak titik kemasukan palsu.
Open chart in a new window