


Emotions influence people not only in their everyday lives but also in trading in financial markets. It is common for people to rely on emotions when making decisions, even though experts recommend trading with a "cool head." Therefore, psychological aspects are an integral part of trading and investing.
Two emotions that primarily guide people when trading on financial markets are fear and greed. Fear can manifest as reluctance to buy an asset because it seems unprofitable, or as fear of missing out on opportunities. Greed is expressed in the desire to buy as much as possible at the most favorable price.
The influence of these two emotions is so significant that a special indicator has been developed based on them, which we will discuss in this article. To learn more about other methods of analyzing and applying digital currencies, you can check out the article Cryptocurrency Basics.
Cryptocurrency fear & greed index
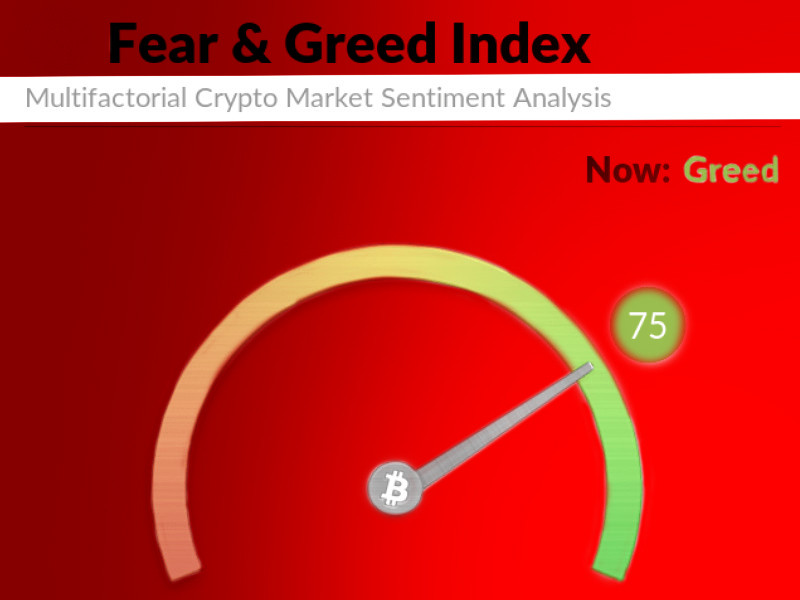
The Fear & Greed Index is one of the most well-known indicators, providing an excellent visual representation of market participants' sentiments. It looks like a car's speedometer with a needle. You've probably seen it many times but may not have known what it was called.
Overall, this indicator has numerical values ranging from 0 to 100. The entire "speedometer" scale is divided into five main zones, as shown in the table below:
| Zone | Numerical value | Characteristic |
| Extreme fear | 0 to 25 | A zone where market participants are highly scared, ready to withdraw funds and exit the market. These values characterize a bear market. |
| Fear | 26 to 44 | A zone indicating fear predominates, and the value of crypto assets is decreasing. In this sector, there is less buying and more selling. |
| Neutral | 45 to 55 | A zone where neither fear nor greed predominates. In such situations, the user must decide whether to buy or sell the asset. |
| Greed | 56 to 85 | A zone indicating greed is dominant. This confirms users' willingness to buy assets, which positively impacts the market situation. |
| Extreme greed | 76 to 100 | A period in which investors are ready to buy everything, including high-risk assets, characterized by a bullish sentiment. |
Let’s take a closer look at what the concepts of "fear" and "greed" mean in the context of cryptocurrency trading. Fear means that investors do not have strong confidence in positive market development and are more likely to consider negative scenarios. As a result, traders open sell positions, leading to a bearish trend.
Greed, on the other hand, means that market participants have an optimistic outlook and are eager to buy crypto assets. This, in turn, leads to the dominance of a bullish trend in the market.
How emotions influence trading
When it comes to trading in financial markets, emotions always play a special role. As long as humans are involved in trading, emotions will continue to influence it. Beyond the fact that we all experience various feelings daily, there's also the concept of temperament, which affects our behavior and actions.
Experts recommend considering your temperament when choosing trading strategies. For example, more assertive cholerics may benefit from active trading, such as scalping, while melancholics might prefer more relaxed strategies, like long-term investments.
The two primary emotions that have always guided and continue to guide traders and investors are fear and greed. No matter how much experts advise making decisions with a "cool head" and not trading under the influence of emotions or stress, fear and greed remain ever-present.
Following the advice of renowned financier Warren Buffett, you should "be fearful when others are greedy, and greedy when others are fearful." This means buying assets when they are undervalued and at their lowest point and selling when they are overvalued.
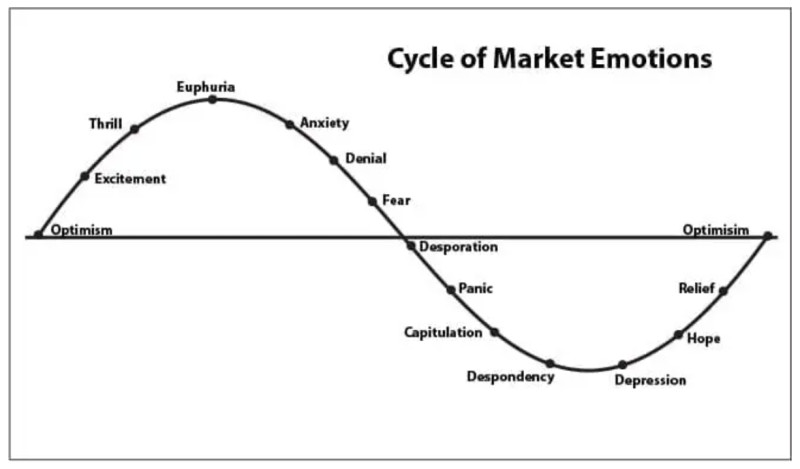
Many factors influence the prevailing sentiment in the market. One of these is the fear of missing out, known as FOMO, which takes over investors during periods of significant price spikes for an asset. They start making rash decisions, trying to "catch the last train." The emotions of market participants cycle from optimism to complete despair, passing through excitement and euphoria, as well as anxiety and fear, panic, and hope, only to return to optimism once again.
The discussed indicator was developed due to the powerful influence of emotions on people's behavior in financial markets. The index allows you to realistically assess market sentiment among other users and utilize this information in decision-making.
How classic index calculated
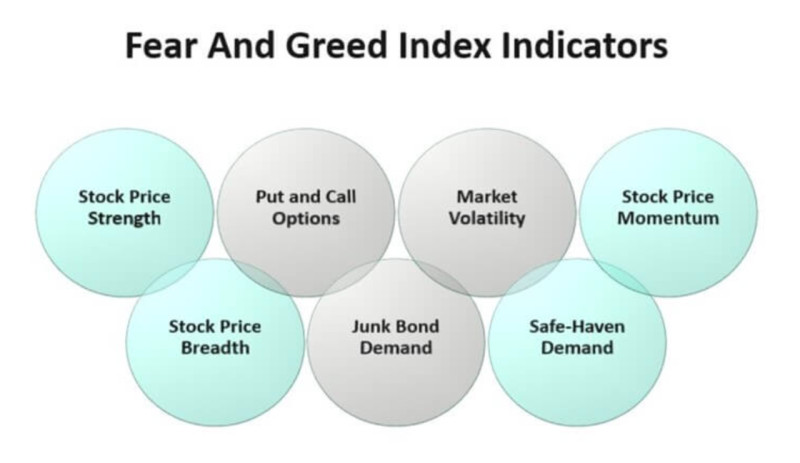
Now that we’ve understood what the cryptocurrency fear and greed index is, let's try to find out how it is calculated in its classical application for the stock market. The calculation of this indicator uses data from seven other indicators:
- Market momentum;
- Market breadth;
- Market strength;
- Demand for risk-free assets;
- Demand for junk bonds;
- Price range (volatility).
To assess Market Momentum, traders apply the ratio of the S&P 500 index to its 125-day moving average. If the chart of the indicator is above the MA, this indicates a bullish trend and greed; if below, it indicates fear's dominance.
Market breadth is calculated as the difference between the total number of rising assets in price on the market and those whose value tends to decline. If the result is negative, it indicates fear is prevailing; if positive, greed is dominant.
Market strength refers to the ratio of assets that have reached the highest and lowest levels over the past year. If the number of rising stocks increases, greed is dominant; if the number of falling stocks increases, fear prevails.
Demand for risk-free assets, such as government bonds, increases during periods of instability and indicates fear is dominant in the market. When the market situation changes, investors opt for more risky and higher-yielding instruments.
Junk bonds are low-rated securities with the least trustworthiness but potentially high returns. When the profit gap between regular bonds and junk bonds narrows, it signals rising greed among investors.
Market volatility is a separate indicator that reflects changes in the US stock market over the past 30 days. This measure rises during market upswings and increases during market downturns. Low values of this indicator suggest rising greed, while high values indicate fear.
History of greed&fear index
The fear and greed index was created by CNN Money for the US stock market. It serves as a barometer of how fair the asset price is at any given moment. It is an attempt to express the emotional component of trading in numerical terms, even though emotions might seem difficult to evaluate objectively, as they are individual and unique to each person. Nevertheless, this index incorporates several parameters that help to provide a broader picture.
During periods dominated by fear, securities may trade significantly below their actual value, meaning they are undervalued. In periods of greed, their price may be unjustifiably high, meaning they are overvalued.
The version of this index for digital currencies was proposed by the website Alternative.me. The developers created a version optimized for the cryptocurrency market, reflecting the impact of investor sentiment on the value of cryptocurrencies.
The company's website allows users to track the index's dynamics since 2018. This indicator was adapted for cryptocurrencies after Bitcoin's massive tenfold surge between 2017 and 2018, followed by the ICO crisis, where $30 billion was raised for crypto projects, 99% of which turned out to be scams.
The index is calculated and published daily on the Alternative.me website. At present, it is calculated specifically for Bitcoin, as this currency reflects the sentiment of the entire digital currency market. However, the index for other major coins is also planned for the future.
What data used in calculation
The index is calculated based on several other indicators. We must also understand the sources of this data and how much weight they carry when calculating the cryptocurrency Fear and Greed Index. There are six key factors:
- Volatility accounts for 25% of the total weight of all components, as it is one of the most crucial characteristics of digital currencies. The fluctuations in value over the past 30 and 90 days are compared, and spikes in price volatility indicate a high level of fear.
- Market volume also accounts for 25%. The relationship between market volume and market momentum is evaluated in comparison to average values over the past 30 and 90 days. If growing volumes of purchases dominate, it indicates greed is prevailing in the market.
- Social media analysis contributes 15%. Currently, the X platform (former Twitter) plays a key role in this parameter. Posts about the coin's hashtags are analyzed, as well as how quickly users respond to them. An overly active response may indicate rising interest and, as a result, increased greed.
- Surveys also make up 15%. The index developers conduct weekly surveys asking users how they perceive the current market situation. Each survey includes 2,000 to 3,000 participants, and their responses shape a picture of investor sentiment.
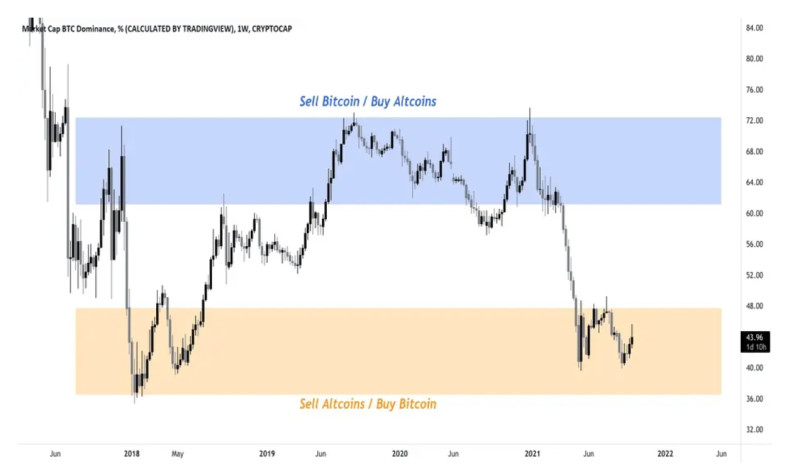
- Coin dominance (10%) is a metric similar to a currency’s share in the total market capitalization. For example, Bitcoin's dominance indicates fear among investors to invest in other tokens. When BTC dominance decreases, it suggests users are willing to invest in riskier crypto assets.
- Trends (10%) are analyzed through Google Trends data related to various cryptocurrency search queries. Not only the frequency of searching for the name of a particular coin is analyzed but also related and popular queries that include coin names.
How to use it
As we've mentioned, the most experienced and successful investors recommend buying during market downturns and selling during periods of rallies. The cryptocurrency fear&greed index helps identify such periods for each specific asset, although it should not be the only argument in decision-making.
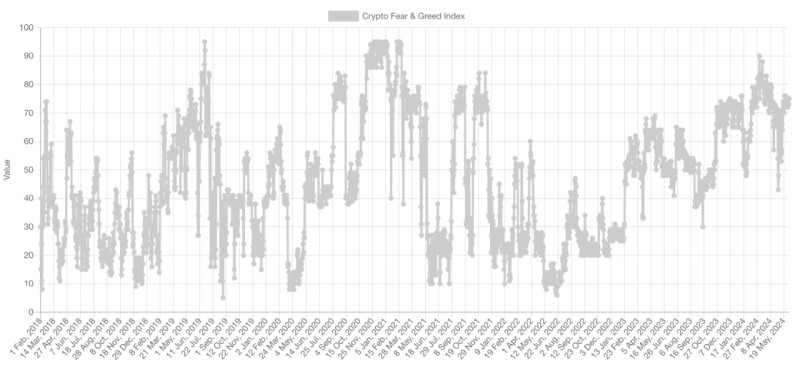
For Bitcoin, for which this index is currently calculated, you can review the entire history of changes in this metric dating back to 2018, when it was first applied to cryptocurrencies.
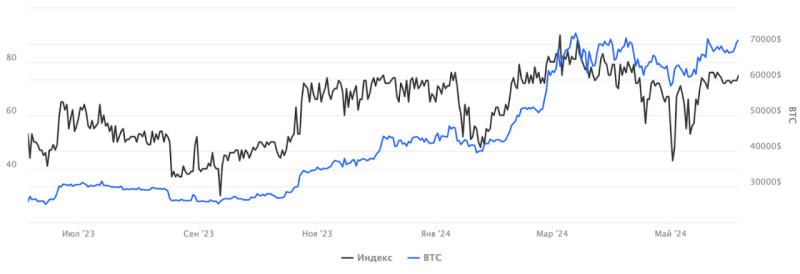
You can compare the readings of this indicator with historical data on Bitcoin's price changes. Based on these data, you can draw some conclusions about how the price correlates with the index and what events have the most significant influence on traders' emotions.
Every trader or investor should use a comprehensive approach to market analysis, including both technical and fundamental analysis. The fear & greed index is a powerful tool because it incorporates a wide variety of factors, but it should not be relied on solely.
Technical analysis involves using special indicators that, based on mathematical formulas, analyze the current state of the market. Using these data, users can make future predictions since markets move in cycles.
Fundamental analysis uses reports and financial data from specific companies, as well as the macroeconomic situation in general. It also evaluates the impact of political, economic, and other factors on asset prices. Although digital currencies are considered decentralized, they cannot be completely isolated from external influences.
Besides, it’s important to remember that this index is not very suitable for long-term strategies. The reason is that during long-term bullish or bearish trends, multiple cycles of fear and greed occur within each trend.
Therefore, investors planning to invest for the long term are unlikely to benefit much from this index. It is more useful for traders who seek to profit from daily fluctuations in the price of a specific digital currency.
How to analyze cryptocurrencies
We’ve mentioned before that it's impossible to deny the role of psychology and emotions in trading in all financial markets, and cryptocurrencies are no exception. This is precisely why technical analysis is based on the theory that the market is cyclical.
This is because human behavior tends to repeat under similar conditions. Supply and demand for certain assets are influenced by instincts and emotions, which are also measured by the cryptocurrency fear and greed index.
The key task of technical analysis is to predict future price movements based on available data on past price fluctuations. Any price movement of an asset is not random; it follows a direction called a trend.
A trend can be upward, downward, or sideways. In the first two cases, there is a clear rise or fall in value, while in the last case, there are minor changes within a certain range. It is important for a trader to determine the current trend and identify when it might end.
Technical analysis doesn’t seek to explain why things happen but helps to forecast the future based on past data. You can profit from both price increases and decreases in digital currencies, so all price changes are taken into account.
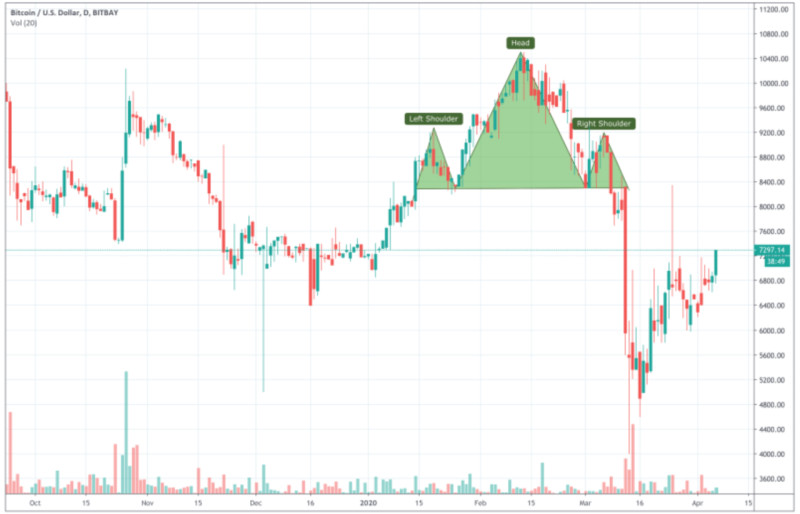
In addition to analyzing indicators, traders can also use non-indicator methods: graphical or candlestick analysis. In graphical analysis, you need to look for patterns on the cryptocurrency’s chart that either suggest a continuation of the current trend or a potential reversal.
Candlestick analysis is similar: on the chart, you identify specific types of candlesticks or combinations that signal whether the current trend will continue or reverse. These methods are convenient because they don’t require any additional tools to be placed on the chart.
How investor can assess cryptocurrency potential
Before investing in any digital asset, it’s important to consider various factors, including the cryptocurrency fear and greed Index. However, as mentioned earlier, this indicator may not be very useful for long-term investors.
So what metrics should they use? For well-known coins like Bitcoin or Ethereum, no deep analysis is required. These currencies have established themselves over the years and are not expected to lose their positions. However, their prices are quite high, and many users look for cheaper alternatives.
Behind every cryptocurrency is a development team, and there should be a website, social media accounts, and other resources. All this is necessary to spread awareness about the project and attract potential investors. You can find information about the coin, the development team, the project, its goals, and more on these platforms.
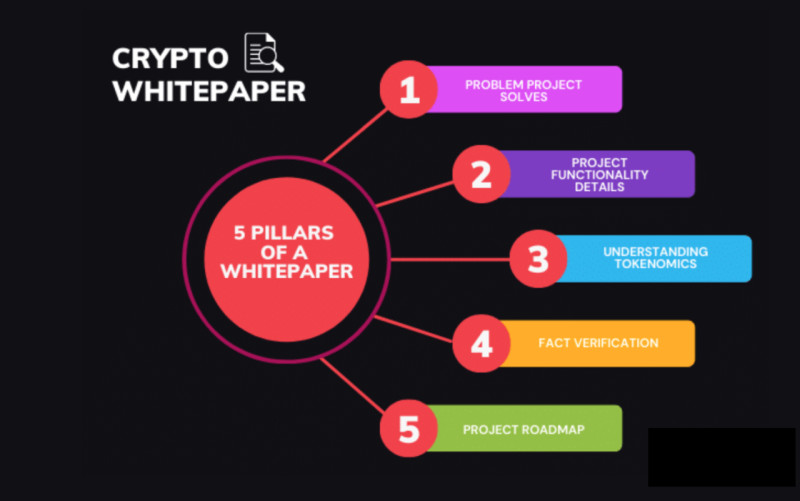
There is also a document called a whitepaper, which contains all the key aspects of the project: how the blockchain works, its consensus mechanism, coin distribution, burning mechanisms, a roadmap of plans, and more.
In every cryptocurrency project, it’s important to study who makes up the development team, their relationships, and the list of partnerships with other organizations. The method of managing the blockchain is also crucial: in some networks, this right is given to holders of the currency.
Next, analyze the market indicators of the selected cryptocurrency: its ranking, trading volumes, market capitalization, the number of coins in circulation, and so on. Additionally, pay attention to the usefulness of the currency—does it have any practical applications?
Be very cautious with new currencies entering the market. On the one hand, such projects are attractive because they may see significant price increases in the future. On the other hand, there’s a risk of falling into fraudulent schemes.
Conclusion
The influence of psychology and emotions on trading digital currencies is so significant that a special tool, the cryptocurrency fear and greed index, was created to measure it. This index helps visualize the dominance of these two emotions among traders and understand the prevailing market sentiment.
This indicator is calculated daily and includes a variety of factors, such as market volume, social media analysis, survey data, current trends, and more. It is most useful for traders interested in short-term price fluctuations of crypto assets.
When the indicator is in the fear zone, it confirms the dominance of a bearish trend and investor uncertainty about the market’s positive development. When the needle moves into the greed zone, it signals increased optimism among investors and the prevalence of a bullish trend.
During periods of fear, digital currencies tend to be undervalued, while during periods of greed, they are likely overvalued. This is why experienced traders recommend buying during fear, when prices are low, and selling or avoiding purchases during greed when prices are high.


