Analysis of Monday's Trades
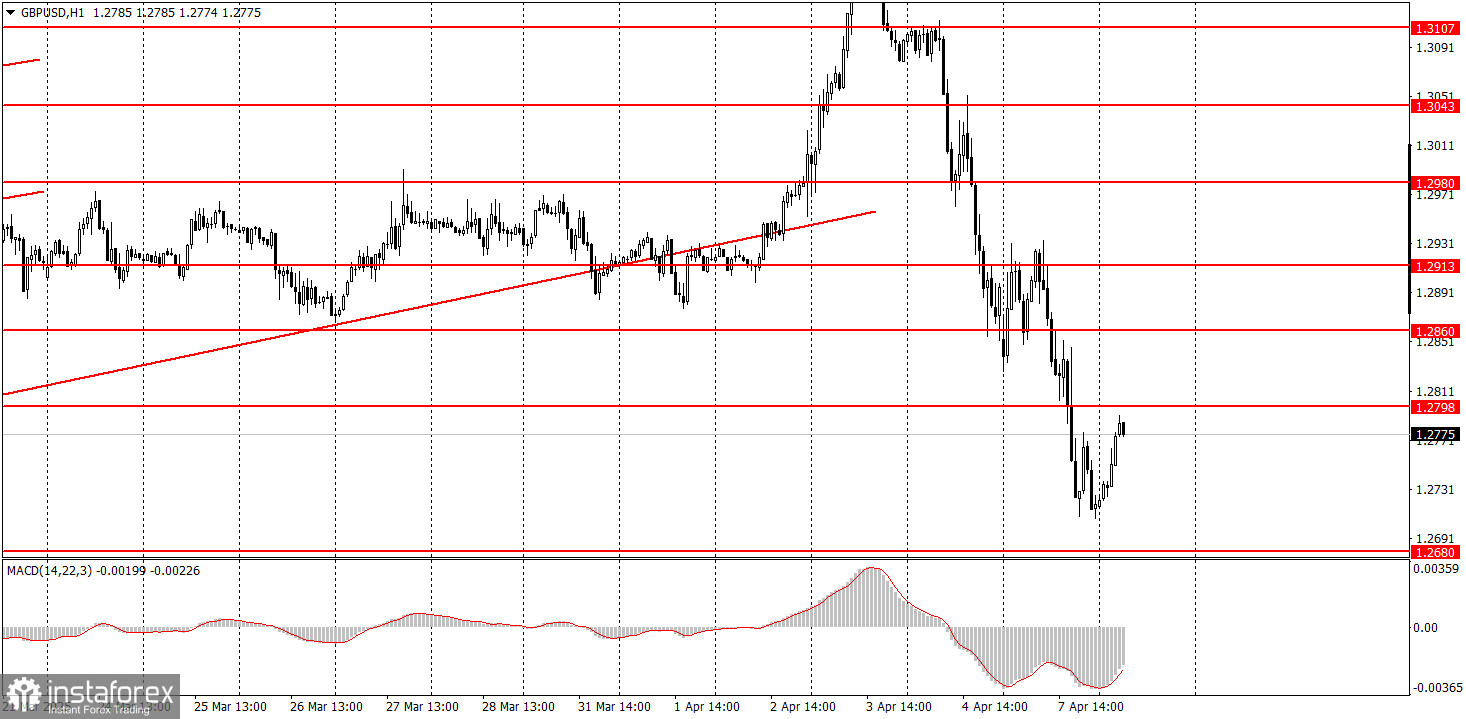
1H Chart of GBP/USD
The GBP/USD pair experienced a significant decline on Monday. It's difficult to understand why the pound, which had been steadily rising against the dollar for a long period, suddenly began to drop sharply. There were no macroeconomic news releases from the UK. London's position on the trade war with the U.S. remains relatively soft. However, as we've already mentioned, market movements have very little logic. Panic reigns in the markets and may persist for some time.
Just yesterday, several headlines emerged: China is reportedly preparing retaliatory tariffs, the European Union is considering 25% tariffs on all imports from the U.S., and Trump intends to punish the defiant with more duties. As a result, markets may continue to swing violently back and forth. There is no clear pattern in these movements.
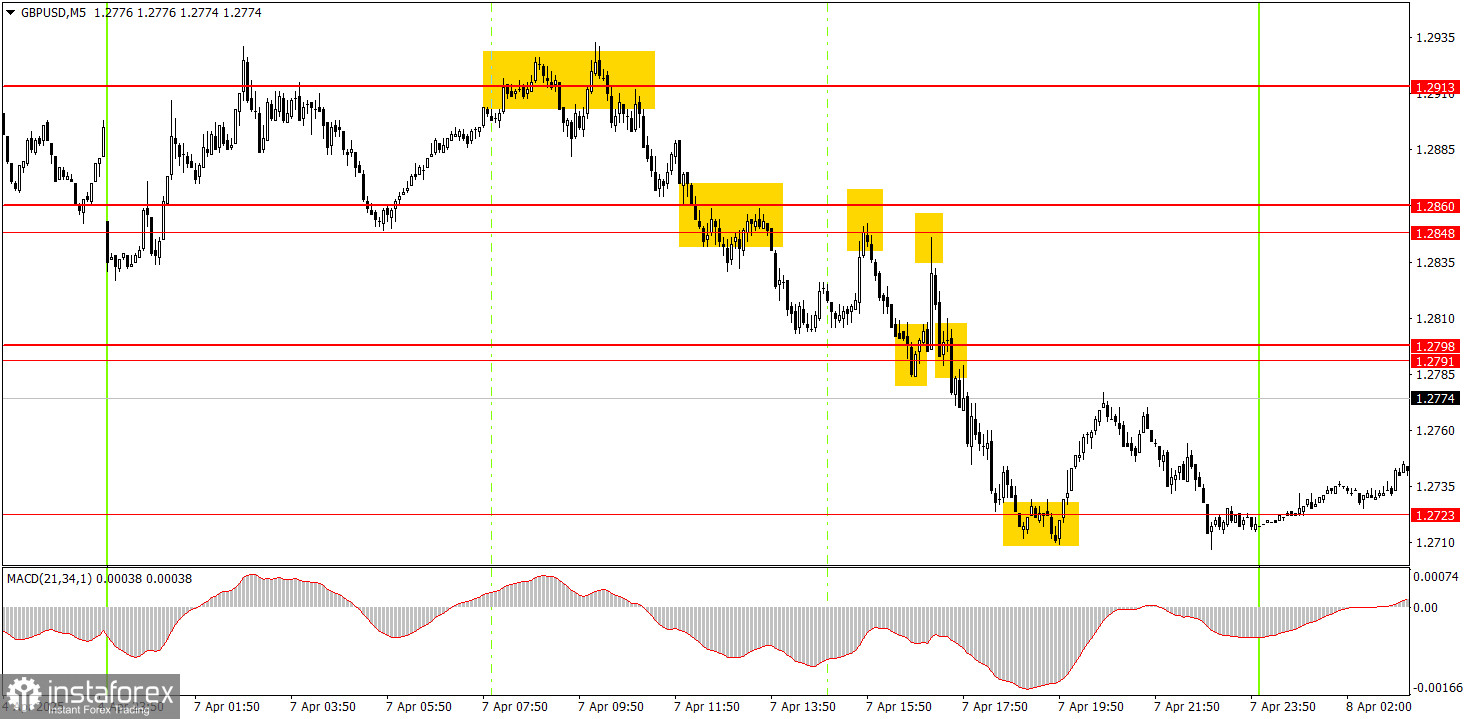
5M Chart of GBP/USD
Due to the extremely high volatility that persisted for several days, many trading signals were formed in the 5-minute timeframe on Monday. Naturally, the price had time to test the levels ten times during the day. The decline began from the 1.2913 level, although that movement was hardly predictable from a fundamental perspective. Good sell signals appeared around the 1.2848–1.2860 area. A breakout of the 1.2791–1.2798 zone also allowed opening short positions.
We want to remind beginners that the current movements are strong and fast, making them potentially dangerous.
Trading Strategy for Tuesday:
On the hourly timeframe, GBP/USD should have started a downtrend long ago, but Trump continues to do everything he can to push the dollar lower. After the official launch of the global trade war, we are no longer attempting to predict how pairs will move in the long term. On Friday, we saw a substantial drop in the pair, which could be the beginning of a significant correction. However, the market remains at the mercy of Trump and his decisions. A renewed collapse in the U.S. dollar is not out of the question if the trade war continues to escalate.
On Tuesday, the GBP/USD pair may remain in turmoil. It's nearly impossible to predict how the pound and the dollar will behave today. Movements are very strong and erratic. The only option is to trade by levels on the 5-minute timeframe—and do so with extreme caution.
The levels for intraday trading on the 5-minute timeframe are: 1.2502–1.2508, 1.2547, 1.2613, 1.2680–1.2685, 1.2723, 1.2791–1.2798, 1.2848–1.2860, 1.2913, 1.2980–1.2993, 1.3043, 1.3102–1.3107, 1.3145–1.3167, 1.3225, 1.3272.
There are no important scheduled events for Tuesday in the UK or the U.S., but significant developments are likely to emerge during the day. Volatility will probably remain high, and market movements will stay chaotic.
Core Trading System Rules:
- Signal Strength: The shorter the time it takes for a signal to form (a rebound or breakout), the stronger the signal.
- False Signals: If two or more trades near a level result in false signals, subsequent signals from that level should be ignored.
- Flat Markets: In flat conditions, pairs may generate many false signals or none at all. It's better to stop trading at the first signs of a flat market.
- Trading Hours: Open trades between the start of the European session and the middle of the US session, then manually close all trades.
- MACD Signals: On the hourly timeframe, trade MACD signals only during periods of good volatility and a clear trend confirmed by trendlines or trend channels.
- Close Levels: If two levels are too close (5–20 pips apart), treat them as a support or resistance zone.
- Stop Loss: Set a Stop Loss to breakeven after the price moves 20 pips in the desired direction.
Key Chart Elements:
Support and Resistance Levels: These are target levels for opening or closing positions and can also serve as points for placing Take Profit orders.
Red Lines: Channels or trendlines indicating the current trend and the preferred direction for trading.
MACD Indicator (14,22,3): A histogram and signal line used as a supplementary source of trading signals.
Important Events and Reports: Found in the economic calendar, these can heavily influence price movements. Exercise caution or exit the market during their release to avoid sharp reversals.
Forex trading beginners should remember that not every trade will be profitable. Developing a clear strategy and practicing proper money management are essential for long-term trading success.