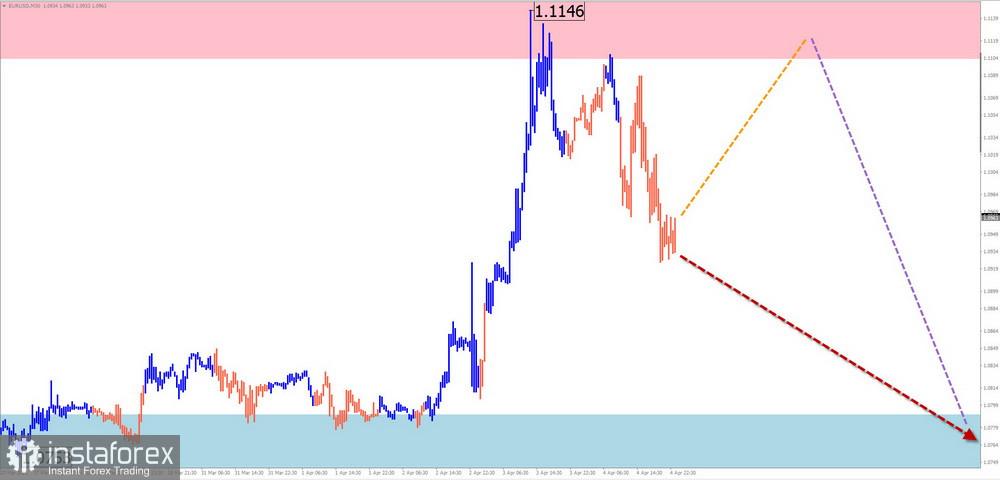
EUR/USD
Analysis: Since February, the euro's price fluctuations have followed an upward wave pattern. Over the past month, the wave structure has formed a stretched corrective flat. Extremes on the chart form a "broadening triangle." The final part of wave (C) is currently unfolding.
Forecast: Price is likely to move sideways within opposing zones. An upward bias is expected early in the week, with potential movement toward the top of the channel. A downward reversal is more probable by the end of the week.
Potential Reversal Zones:
- Resistance: 1.1100 / 1.1150
- Support: 1.0790 / 1.0740
Recommendations:
- Buying may be profitable with reduced volume sizes and within intraday timeframes.
- Selling is premature until confirmed reversal signals appear near the resistance zone.
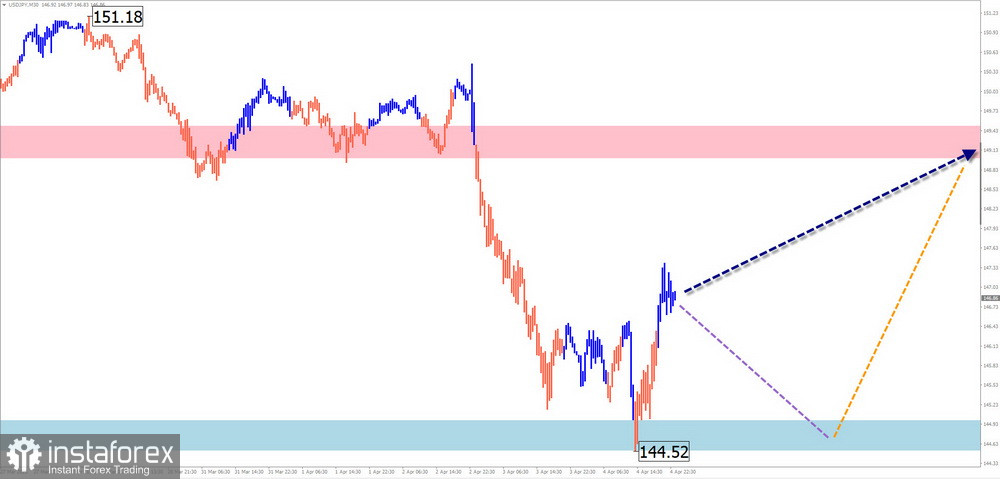
USD/JPY
Analysis: The downward wave that began in December in the major yen pair is forming its final wave (C). A counter-correction has been unfolding since March 20 as a stretched flat, and it is not yet complete.
Forecast: Expect continued sideways movement in the coming days, possibly with a short-term decline toward the support zone. A shift toward upward movement is more likely toward the end of the week.
Potential Reversal Zones:
- Resistance: 149.00 / 149.50
- Support: 145.00 / 144.50
Recommendations:
- Selling is acceptable for short-term intraday trades with reduced volume sizes.
- Buying becomes relevant only after confirmed reversal signals appear near the support zone.
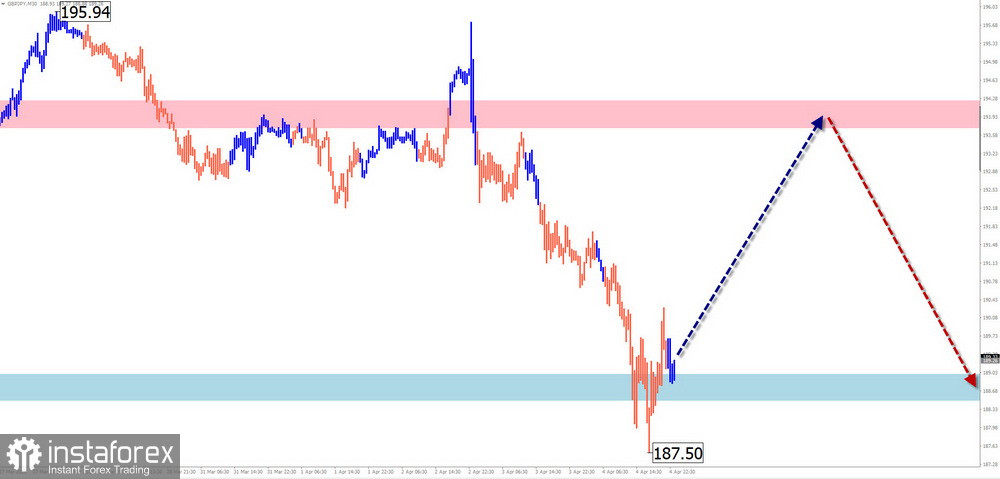
GBP/JPY
Analysis: Since July last year, the GBP/JPY pair has been trending upward. Over the past month, a sideways correction in the form of a stretched flat has developed within the wave structure. The structure appears incomplete.
Forecast: Expect a sideways to upward bias over the next couple of days. A reversal near resistance is likely, with renewed downward movement anticipated in the second half of the week.
Potential Reversal Zones:
- Resistance: 193.70 / 194.20
- Support: 189.00 / 188.50
Recommendations:
- Buying is high risk and may result in losses.
- Selling is preferable after confirmed reversal signals near resistance.
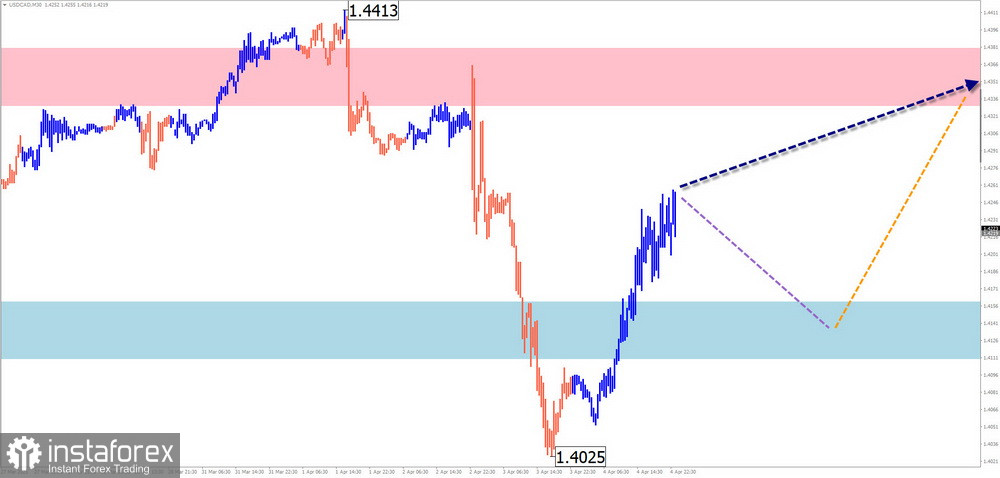
USD/CAD
Analysis: On the 4-hour chart, the USD/CAD pair is forming a downward wave starting from February. As of the current analysis, minimal completion conditions have been met. Since April 3, an upward segment has emerged, showing strong reversal potential.
Forecast: Expect a flat sideways mood for the next couple of days, possibly followed by a drop toward support. In the second half of the week, an upward move is expected, potentially reaching the resistance zone at the bottom of a strong higher-timeframe reversal area.
Potential Reversal Zones:
- Resistance: 1.3720 / 1.4330
- Support: 1.4160 / 1.4110
Recommendations:
- Selling is risky with limited profit potential.
- Buying can be considered after confirmation from your trading system (TS), although the upside is capped near resistance.
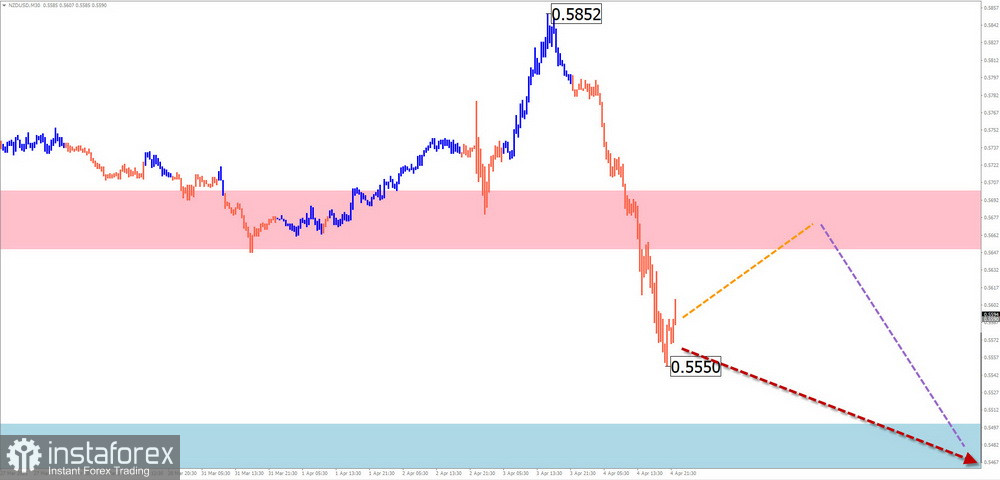
NZD/USD
Analysis: The incomplete downward wave on NZD/USD has been unfolding since late September last year. Since December, a corrective contracting flat has formed within the structure. The recent decline from April 3 shows reversal potential.
Forecast: Expect sideways movement early in the week, potentially with an upward move toward resistance. A downward reversal is likely to follow. The calculated support defines the expected lower boundary for the weekly range.
Potential Reversal Zones:
- Resistance: 0.5650 / 0.5700
- Support: 0.5500 / 0.5450
Recommendations:
- Buying lacks potential and is high risk.
- Selling may become the main trading strategy after confirmed reversal signals near resistance.
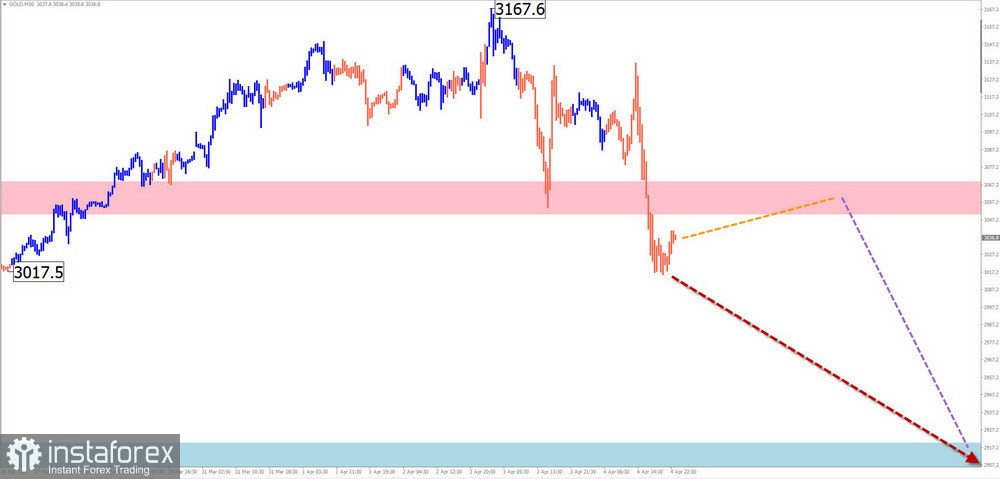
GOLD
Analysis: Gold continues to break records. Last week, prices reached the lower boundary of the weekly timeframe's potential reversal zone. After some pressure at the end of last week, prices began pulling back, forming a correction against the recent upward trend.
Forecast: Sideways movement near resistance is likely in the first half of the week. Volatility and a potential reversal to the downside may increase in the second half of the week.
Potential Reversal Zones:
- Resistance: 3050.0 / 3070.0
- Support: 2920.0 / 2900.0
Recommendations:
- Buying has limited potential and could result in losses.
- Selling becomes relevant after confirmation from your trading system near the support zone.
Note: In simplified wave analysis (SWA), all waves consist of three parts (A-B-C). The analysis focuses on the last, incomplete wave on each timeframe. Expected movements are shown with dashed lines.