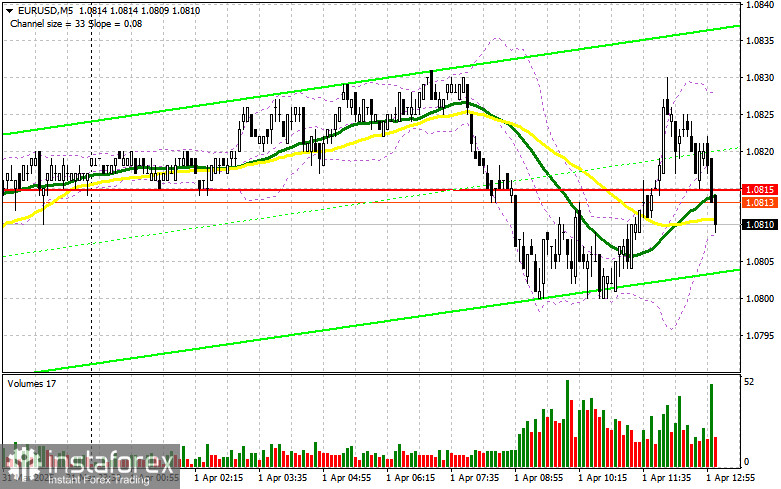
In my morning forecast, I highlighted the level of 1.0815 and planned to make market entry decisions based on it. Let's look at the 5-minute chart and analyze what happened there. A decline did occur, but there was no formation of a false breakout, so no entry point was confirmed. The technical outlook was revised for the second half of the day.
To open long positions on EUR/USD:
Rather weak data on manufacturing activity in Eurozone countries understandably did not support the euro in the first half of the day. In the second half, similar data will be released in the U.S., including the ISM Manufacturing PMI, JOLTS job openings data from the Bureau of Labor Statistics, and a speech from FOMC member Thomas Barkin. A hawkish tone from the Fed representative—especially ahead of tomorrow's crucial announcements—could support the dollar.
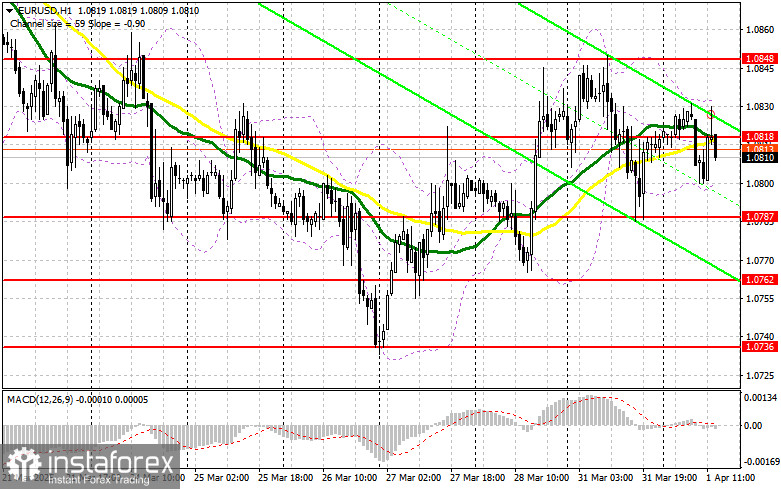
If the euro declines after the reports, only a false breakout around the 1.0787 support level will serve as a signal for new long positions in EUR/USD, aiming for a return of the bullish trend and a retest of 1.0818. A breakout and retest of this range will confirm a valid entry point for buying with a target of 1.0848. The ultimate target will be 1.0884, where I will take profit.
If EUR/USD declines and there is no activity around 1.0787, pressure on the euro will intensify. In this case, sellers could push the pair down to 1.0762. Only after a false breakout form will I consider buying the euro. I also plan to open long positions on a rebound from 1.0736 with a target of a 30–35 point intraday correction.
To open short positions on EUR/USD:
Sellers made a comeback, but the pair didn't break out of the newly formed sideways channel—and it likely won't. Everyone is awaiting Trump's tariff announcements, so the dollar is more likely to be in demand than risk assets. If the U.S. PMI data triggers a negative market reaction, only a false breakout near the 1.0818 resistance level—which earlier acted as support—will provide a signal for short positions with a target of another move toward 1.0787. A breakout and consolidation below this range will be a suitable selling opportunity, targeting 1.0762. The ultimate target will be 1.0736, where I will take profit.
If EUR/USD rises in the second half of the day and bears fail to act around 1.0818—where the moving averages are—buyers could gain control and push the pair higher. In that case, I will delay short positions until a test of the next resistance at 1.0848, and only sell after a failed consolidation attempt. I plan to open short positions on a rebound from 1.0884, targeting a 30–35 point intraday correction.
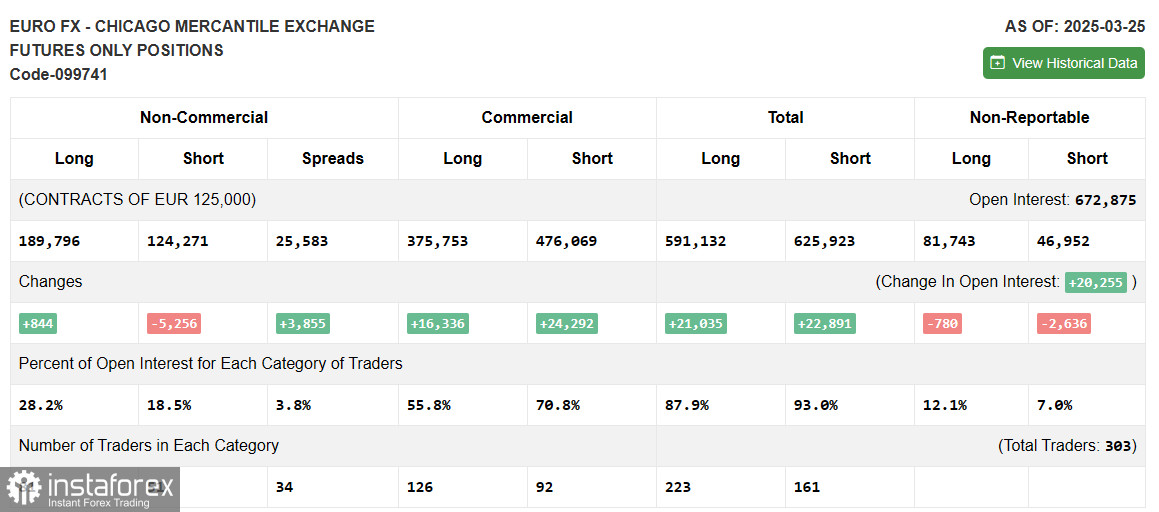
In the COT report (Commitments of Traders) for March 25, there was a slight increase in long positions and a rather significant decrease in shorts. There is no noticeable increase in euro buyers, but sellers continue to exit the market. Given the recent Eurozone inflation data and statements from ECB officials, the regulator's stance is likely to remain unchanged at the April meeting, which may temporarily support the euro. However, much will depend on the extent to which U.S. tariffs affect other countries. The more serious the threat of global economic slowdown, the greater the pressure will be on risk assets, including the euro.
The COT report shows that long non-commercial positions rose by 844 to 189,796, while short non-commercial positions dropped by 5,256 to 124,271. As a result, the gap between long and short positions increased by 3,855.
Indicator signals:
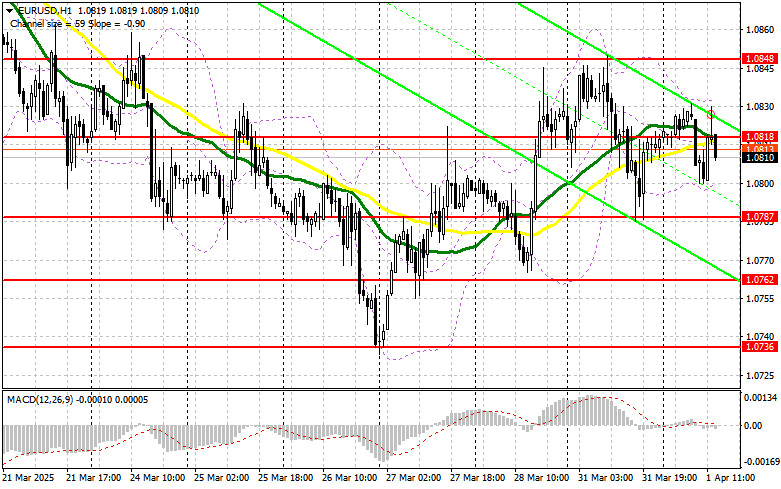
Moving averages: Trading is occurring around the 30- and 50-day moving averages, indicating a sideways market.
Note: The period and prices of the moving averages are considered by the author on the hourly H1 chart and may differ from the classical daily moving averages on the D1 chart.
Bollinger Bands: In case of a decline, the lower boundary of the indicator around 1.0800 will serve as support.
Indicator descriptions:
- Moving Average (MA): Smooths out volatility and noise to define the current trend. Period – 50 (yellow on the chart); Period – 30 (green on the chart).
- MACD (Moving Average Convergence/Divergence): Fast EMA – period 12; Slow EMA – period 26; Signal line SMA – period 9.
- Bollinger Bands: Period – 20.
- Non-commercial traders: Speculators such as individual traders, hedge funds, and large institutions using the futures market for speculative purposes.
- Long non-commercial positions: Total open long positions held by non-commercial traders.
- Short non-commercial positions: Total open short positions held by non-commercial traders.
- Net non-commercial position: The difference between long and short positions held by non-commercial traders.