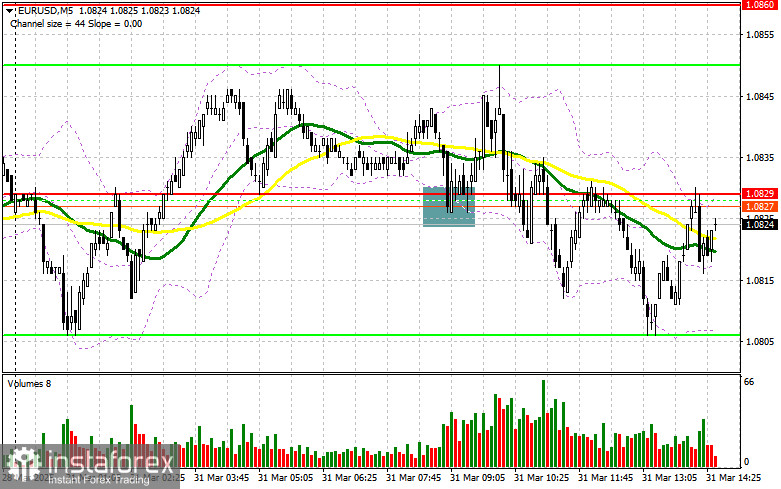
In my morning forecast, I highlighted the 1.0829 level and planned to make trading decisions based on it. Let's look at the 5-minute chart to see what happened. A decline followed by a false breakout around 1.0829 provided an entry point for long positions, resulting in a 20-point rise in the pair. The technical picture has not been revised for the second half of the day.
To open long positions on EUR/USD:
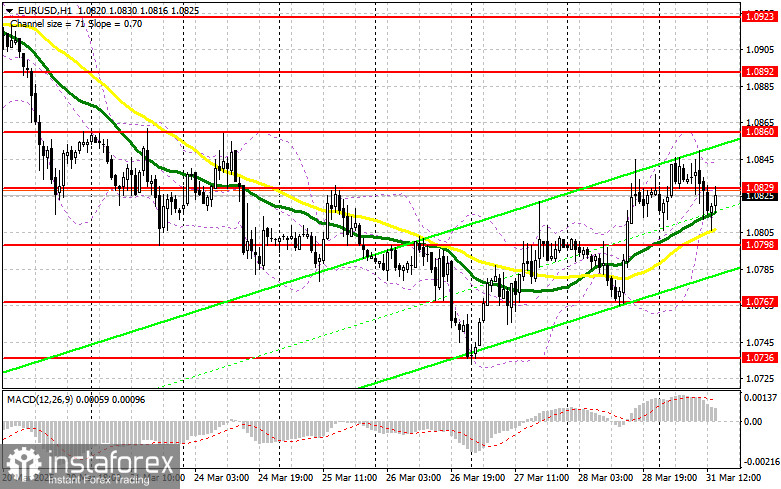
Retail sales data from Germany exceeded economists' forecasts, but it provided only temporary support for the euro. Pressure on the pair soon returned. For the rest of the day, there's only the Chicago PMI, so the euro still has a chance to strengthen—provided, of course, that Donald Trump doesn't come up with anything new. If the euro falls after the report, which is unlikely, only a false breakout around the 1.0798 support will provide a signal to buy EUR/USD in hopes of building a new bullish market with a target of retesting 1.0829. A breakout and a retest of this range from top to bottom will confirm the right entry point for long positions, with a move toward 1.0860. The final target will be the 1.0892 area, where I will take profit. If EUR/USD declines and there is no activity near 1.0798, pressure on the euro will intensify. In this case, sellers may push the pair down to 1.0767. Only after a false breakout there will I consider buying. I plan to open long positions immediately on a rebound from 1.0736, aiming for a 30–35 point intraday correction.
To open short positions on EUR/USD:
Sellers made their presence known, shifting trading into a sideways channel, and without major statistics today, it may be difficult to break out of this range. In case of a negative reaction to the PMI data, only a false breakout around the 1.0829 resistance, which served as support earlier in the day, will provide an entry point for shorts, with the goal of another decline toward 1.0798, which was nearly reached earlier. A breakout and consolidation below this range will be a suitable selling opportunity with a move toward 1.0767. The final target will be the 1.0736 area, where I will take profit. If EUR/USD rises in the second half of the day and bears show no activity around 1.0829, buyers may push the pair higher. In this case, I will delay shorts until a test of the next resistance at 1.0860. I will sell there only after a failed consolidation. If there is no downward movement there either, I will look to sell on a rebound from 1.0892, aiming for a 30–35 point correction.
Commitments of Traders (COT) Report:
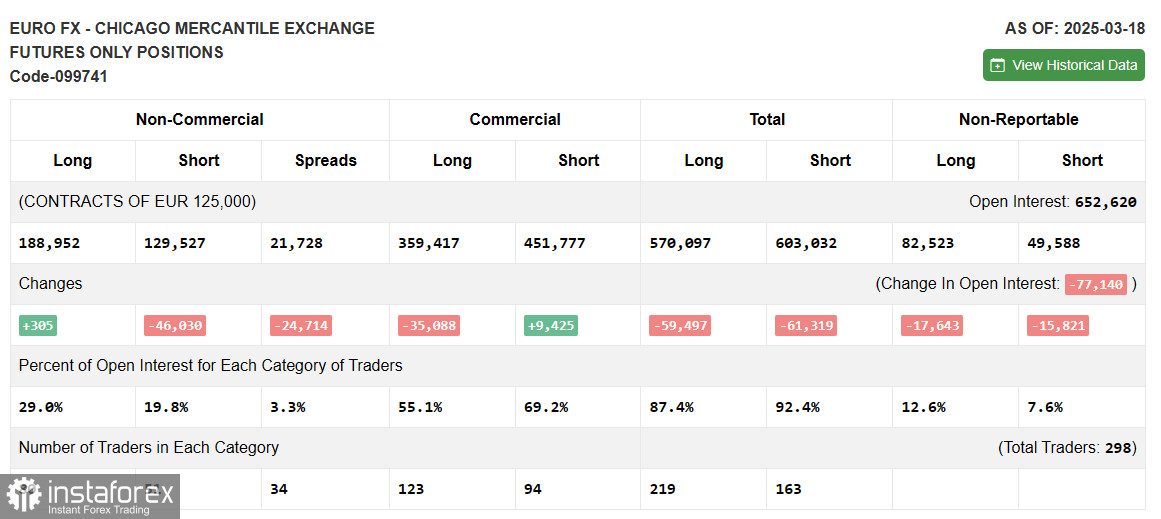
The COT report for March 18 showed an increase in long positions and a significant reduction in shorts. More traders are willing to buy euros, while sellers continue to exit the market. The European Central Bank's cautious approach to rate cuts and weak US fundamentals—forcing the Fed to return to a more dovish policy—are causing a notable shift in market dynamics. The COT report indicates that long non-commercial positions rose by 305 to 188,952, while short non-commercial positions fell by 46,030 to 129,527. As a result, the gap between long and short positions narrowed by 24,714.
Indicator Signals:
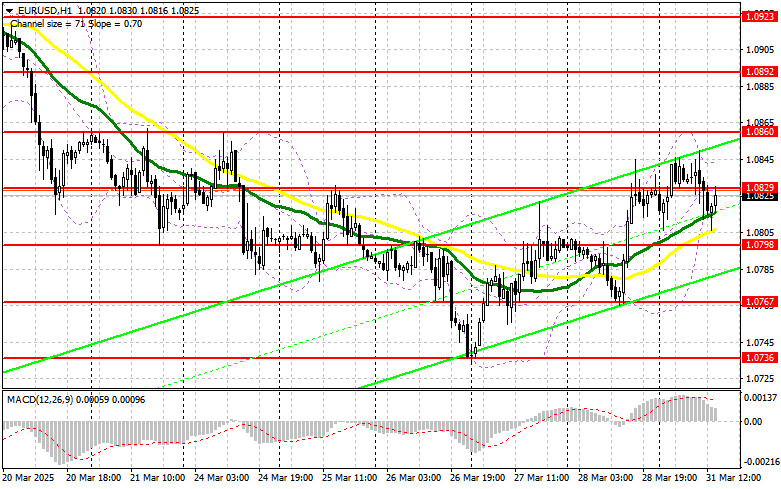
Moving Averages: Trading is taking place around the 30- and 50-day moving averages, indicating a sideways market.
Note: The period and prices of the moving averages are based on the author's analysis of the hourly (H1) chart and may differ from classical daily (D1) moving averages.
Bollinger Bands: In the event of a decline, the lower boundary of the indicator around 1.0805 will act as support.
Indicator Descriptions: • Moving average – determines the current trend by smoothing out volatility and noise. Period – 50 (marked in yellow on the chart); • Moving average – determines the current trend by smoothing out volatility and noise. Period – 30 (marked in green on the chart); • MACD (Moving Average Convergence/Divergence) – Fast EMA: period 12; Slow EMA: period 26; SMA: period 9; • Bollinger Bands – Period: 20; • Non-commercial traders – speculators such as individual traders, hedge funds, and large institutions using the futures market for speculative purposes and meeting certain requirements; • Long non-commercial positions – total long open positions held by non-commercial traders; • Short non-commercial positions – total short open positions held by non-commercial traders; • Total non-commercial net position – the difference between short and long non-commercial positions.