The GBP/USD currency pair continued to trade sideways near its highs on Friday. This sideways movement has persisted for several weeks, and the British pound has not managed even a minimal correction after its strong rally. Therefore, it is extremely difficult to expect meaningful growth in the U.S. dollar, even though the broader trends on the daily and monthly timeframes remain bearish.
For now, Donald Trump's actions alone are enough to keep the U.S. currency under pressure—or, at the very least, prevent it from rising. On top of that, several recent reports from the UK have shown positive results, and the Bank of England has slightly toughened its monetary policy stance. So, even without these factors, it would be difficult for the dollar to gain ground—and with them, even more so.
This week, the dollar is facing a series of significant tests. On April 2, Donald Trump is expected to announce new tariffs, though it's unclear which countries or sectors they will target. Given that the U.S. president has dubbed April 2 "America's Liberation Day," the tariffs are likely to be substantial. There have been rumors that Trump has softened his stance on trade duties, but these remain unconfirmed. And last week's developments suggest those rumors may be false.
In addition, this week, the U.S. will release a series of key reports on the labor market, unemployment, job openings, wages, and ISM business activity. Any one of these reports could create new problems for the dollar. If a report is strong, the greenback may still not rally due to Trump's influence. And if a report is weak, it could trigger yet another wave of selling. In short, the forex market continues to revolve around the U.S. president.
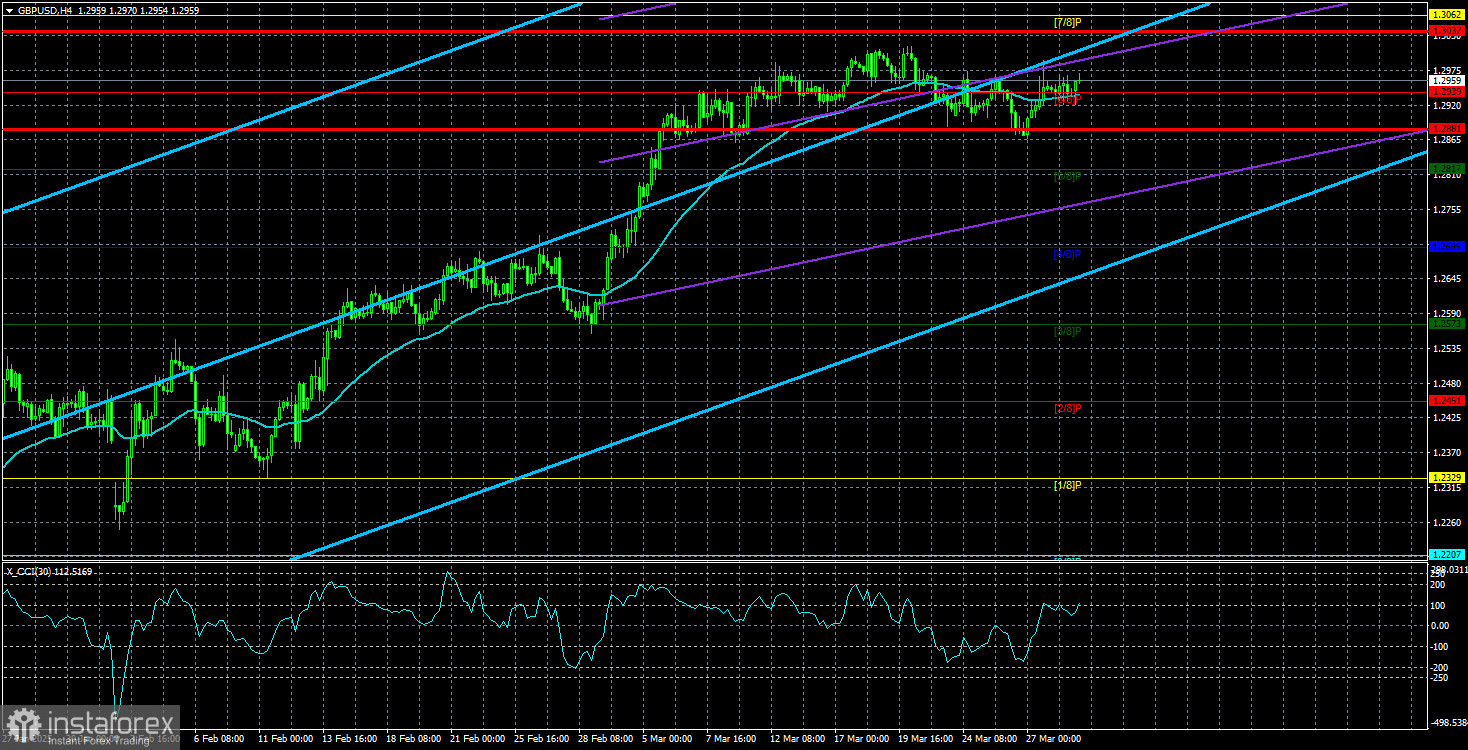
In the UK, the only scheduled releases this week are business activity indices, which currently don't carry much weight with the market. Technically, the pound has consolidated above the moving average on the H4 timeframe, but since a sideways trend has formed in recent weeks, this doesn't mean much. GBP/USD volatility has been relatively low lately. No significant events are scheduled for Monday in the UK or the U.S., so the market will likely remain cautious, waiting for Wednesday's U.S. data. That data will then serve as a reason to trigger fresh dollar sell-offs. The dollar can only hope to avoid an even steeper decline for now.
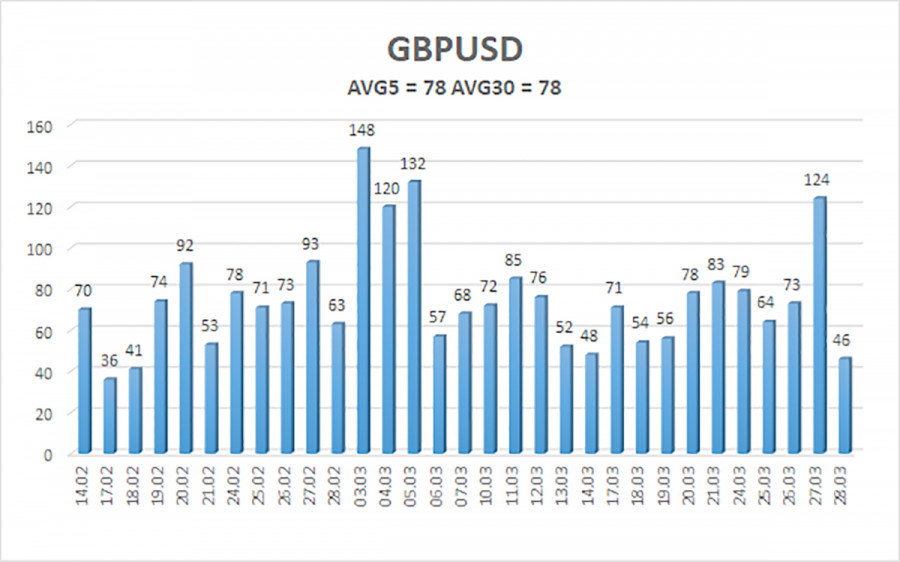
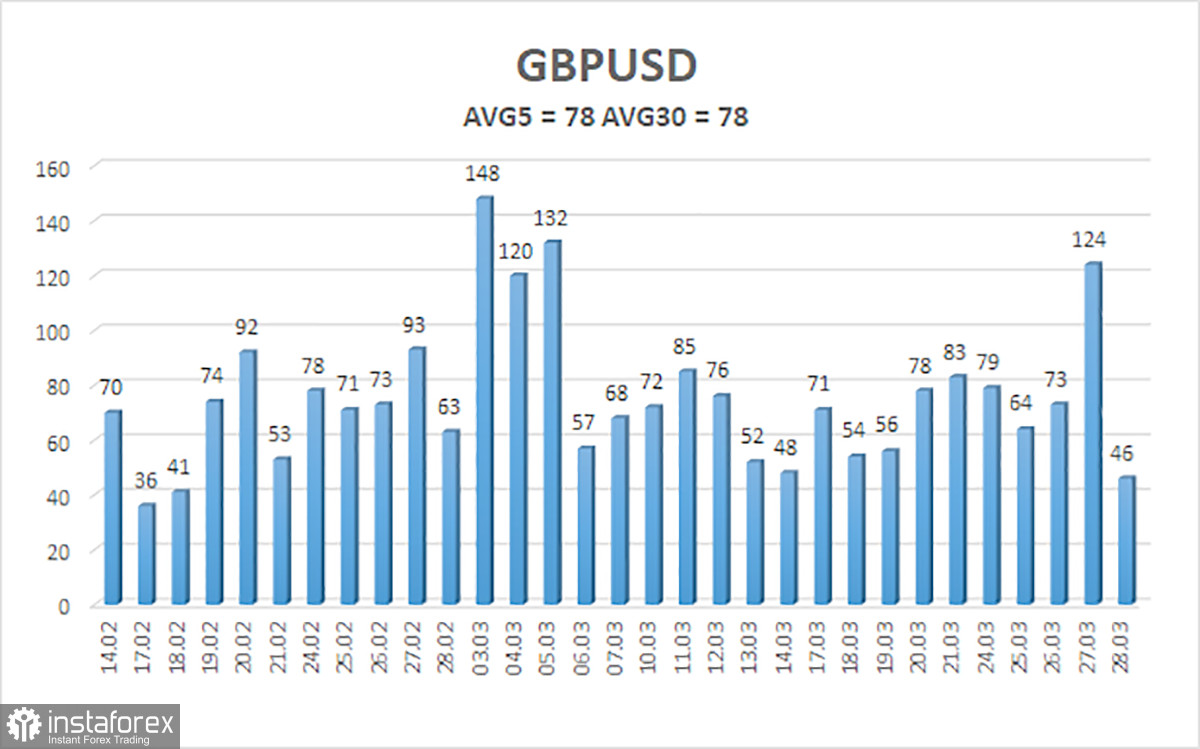
The average volatility of the GBP/USD pair over the last five trading days is 78 pips, which is considered "average" for this currency pair. On Monday, March 31, we expect the pair to trade within a range limited by 1.2881 and 1.3037. The long-term regression channel has turned upward, but the downtrend remains intact on the daily timeframe. The CCI indicator has not recently entered overbought or oversold territory.
Nearest Support Levels:
S1 – 1.2939
S2 – 1.2817
S3 – 1.2695
Nearest Resistance Levels:
R1 – 1.3062
R2 – 1.3184
R3 – 1.3306
Trading Recommendations:
The GBP/USD pair retains a medium-term bearish trend, while the ongoing minor correction on the H4 timeframe may end at any moment as the market continues to avoid buying the dollar. We still do not consider long positions valid since the current upward move appears to be a corrective wave on the daily timeframe and has already taken on an illogical character. However, if you trade strictly on technical signals, long positions remain relevant with targets at 1.3037 and 1.3062, provided the price stays above the moving average. Short positions remain attractive with targets at 1.2207 and 1.2146 since the upward correction on the daily chart should eventually end (unless the broader downtrend ends first). The British pound appears significantly overbought and unjustifiably expensive, and Donald Trump will not be able to devalue the dollar indefinitely. But it's difficult to predict how long this Trump-driven dollar slump will last.
Explanation of Illustrations:
Linear Regression Channels help determine the current trend. If both channels are aligned, it indicates a strong trend.
Moving Average Line (settings: 20,0, smoothed) defines the short-term trend and guides the trading direction.
Murray Levels act as target levels for movements and corrections.
Volatility Levels (red lines) represent the likely price range for the pair over the next 24 hours based on current volatility readings.
CCI Indicator: If it enters the oversold region (below -250) or overbought region (above +250), it signals an impending trend reversal in the opposite direction.