Analysis of Thursday's Trades
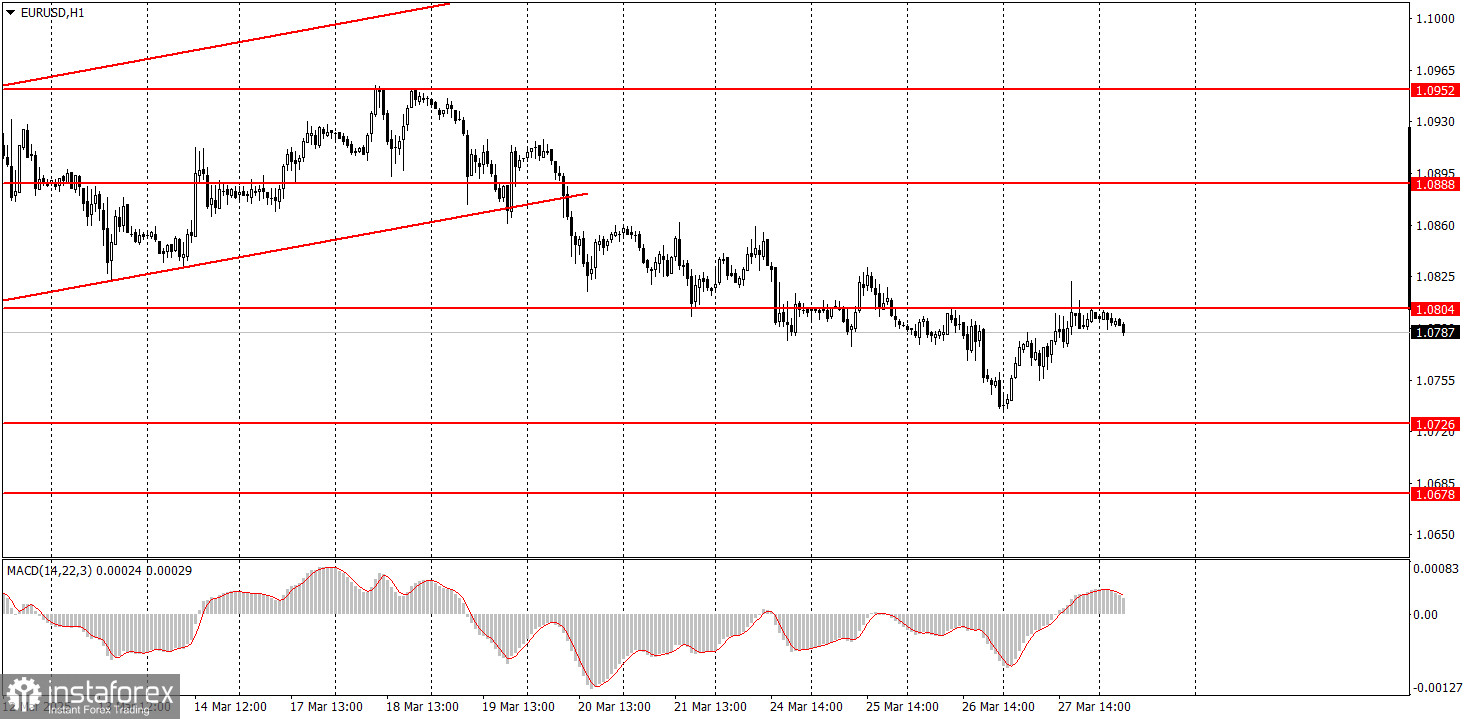
1H Chart of EUR/USD
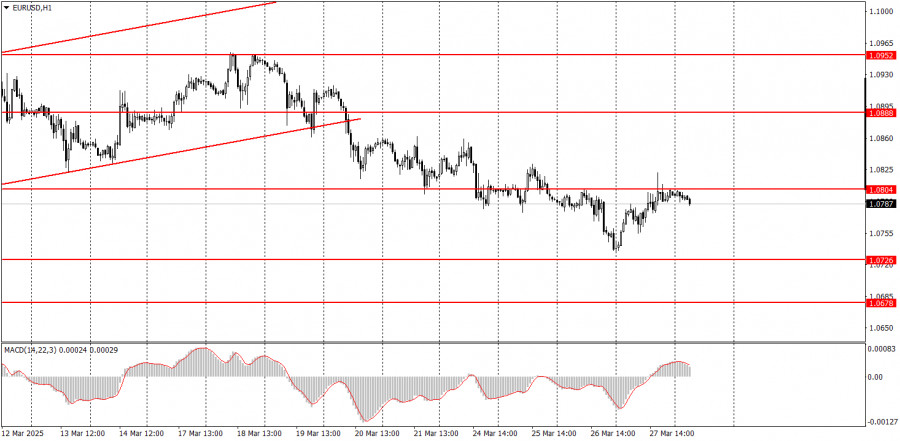
The EUR/USD currency pair rose to the 1.0804 level on Thursday. Naturally, such an unexpected and relatively strong rise in the euro (or, more accurately, a drop in the dollar) could only be triggered by one person—Donald Trump. Overnight, he announced new tariffs on imports to the U.S., this time targeting all foreign-manufactured automobiles. Elon Musk is celebrating, and the dollar is falling again, as the market has repeatedly shown a highly negative reaction to the new U.S. president's trade policies. However, it's worth noting that the dollar's decline wasn't particularly sharp this time, and the U.S. currency has been climbing—albeit as part of a correction—for nearly two weeks. We've already said that Trump's tariffs are a short-term negative for the U.S. economy. Still, the dollar can't lose 10 cents over a couple of months if the economy isn't contracting and there is no macroeconomic evidence of deterioration. The U.S. economy showed stronger-than-expected growth in the fourth quarter.
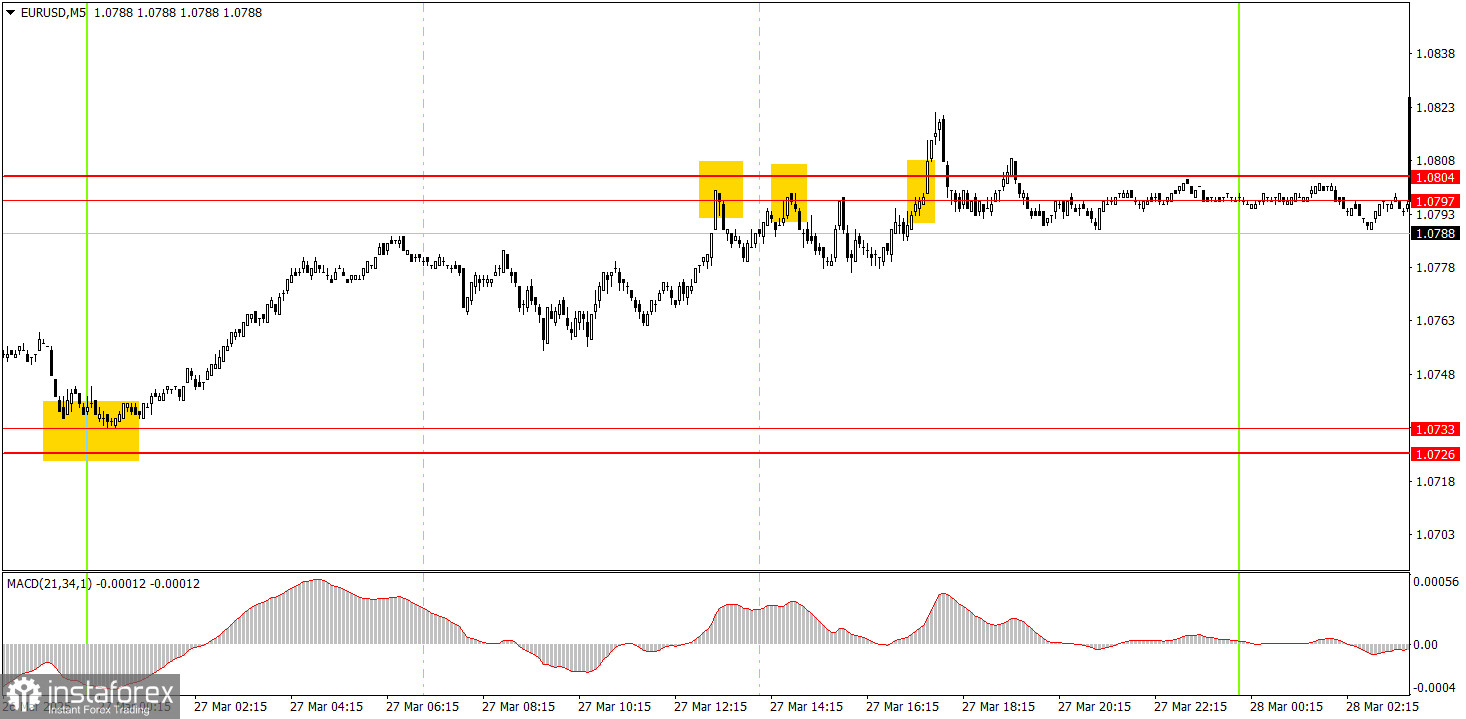
5M Chart of EUR/USD
On Thursday, a solid trading signal and three mediocre ones were formed in the 5-minute timeframe. The first rebound from the 1.0733 level alone offered an excellent profit opportunity. Unfortunately, that signal was formed at night, so few traders likely took advantage of it. During the day, the price repeatedly bounced off the 1.0797–1.0804 area and broke through it once. But by then, the upward momentum had already faded.
Trading Strategy for Friday:
On the hourly timeframe, the EUR/USD pair remains in a medium-term downtrend, although the chances of its continuation are dwindling. Since the fundamental and macroeconomic background still favors the U.S. dollar much more than the euro, we continue to expect a decline. However, Trump keeps pushing the dollar downward with his recurring tariff decisions and statements about how the world should be organized to suit the U.S. Fundamentals and macroeconomics remain overshadowed by politics and geopolitics, so we are not expecting any strong dollar growth for now.
On Friday, the euro may resume its decline, as a downward trend has started forming on the hourly timeframe. The dollar is oversold and has depreciated too sharply and unjustifiably in recent weeks. A continued correction seems likely.
On the 5-minute timeframe, the following levels should be monitored: 1.0433–1.0451, 1.0526, 1.0596, 1.0678, 1.0726–1.0733, 1.0797–1.0804, 1.0859–1.0861, 1.0888–1.0896, 1.0940–1.0952, 1.1011, and 1.1048. For Friday, the only notable release in the Eurozone is Germany's unemployment rate, while in the U.S., attention will turn to the PCE index and the University of Michigan consumer sentiment index. We believe the latter is the more important of the two.
Core Trading System Rules:
- Signal Strength: The shorter the time it takes for a signal to form (a rebound or breakout), the stronger the signal.
- False Signals: If two or more trades near a level result in false signals, subsequent signals from that level should be ignored.
- Flat Markets: In flat conditions, pairs may generate many false signals or none at all. It's better to stop trading at the first signs of a flat market.
- Trading Hours: Open trades between the start of the European session and the middle of the US session, then manually close all trades.
- MACD Signals: On the hourly timeframe, trade MACD signals only during periods of good volatility and a clear trend confirmed by trendlines or trend channels.
- Close Levels: If two levels are too close (5–20 pips apart), treat them as a support or resistance zone.
- Stop Loss: Set a Stop Loss to breakeven after the price moves 15 pips in the desired direction.
Key Chart Elements:
Support and Resistance Levels: These are target levels for opening or closing positions and can also serve as points for placing Take Profit orders.
Red Lines: Channels or trendlines indicating the current trend and the preferred direction for trading.
MACD Indicator (14,22,3): A histogram and signal line used as a supplementary source of trading signals.
Important Events and Reports: Found in the economic calendar, these can heavily influence price movements. Exercise caution or exit the market during their release to avoid sharp reversals.
Forex trading beginners should remember that not every trade will be profitable. Developing a clear strategy and practicing proper money management are essential for long-term trading success.