GBP/USD 5-Minute Analysis
The GBP/USD currency pair showed a powerful upward movement on Thursday. Naturally, the catalyst was once again Donald Trump, who imposed new 25% tariffs on all automobile imports to the U.S. Needless to say, the market once again dumped the dollar like a bad dream. Not even the U.S. GDP report, which showed fourth-quarter growth at 2.4% versus the expected 2.3%, could save the American currency. But that didn't matter to traders, just like many other recent reports that could have supported the dollar. The market continues to react exclusively to Trump's tariff decisions. And while the euro appreciated within reasonable bounds yesterday, the pound—as usual—moved much more aggressively.
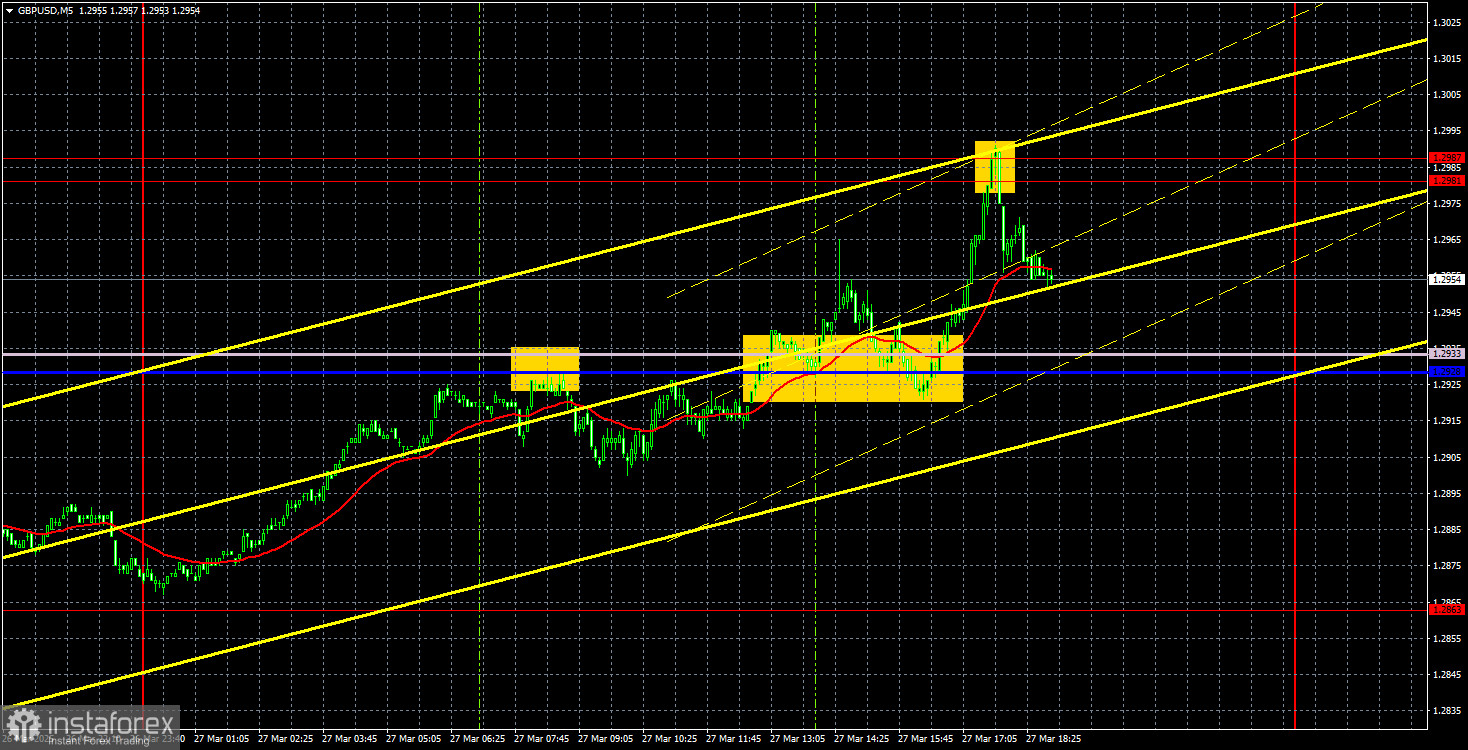
When examining the overall trend, it still seems to be moving sideways. This is not a classic flat range with clear boundaries, so trading bounces off those levels isn't viable. The price swings back and forth, resembling a "see-saw" pattern. So even if Trump hadn't announced new tariffs yesterday, we likely would have seen growth in GBP/USD anyway—just not as sharp. The Ichimoku indicator lines currently hold little relevance, although signals occasionally form around them.
Yesterday, almost all signals were formed around these lines, but they were of questionable quality, as the lines were positioned in the middle of the overall move, which had begun overnight. Traders could have worked with the first bounce and the second breakout, which provided at least a 20-pip move in the right direction. The last signal, a bounce from the 1.2981–1.2987 zone, looked good but was risky to trade. First, the pound was already climbing again. Second, Trump had just introduced new tariffs. Third, the signal formed late in the day.
COT Report
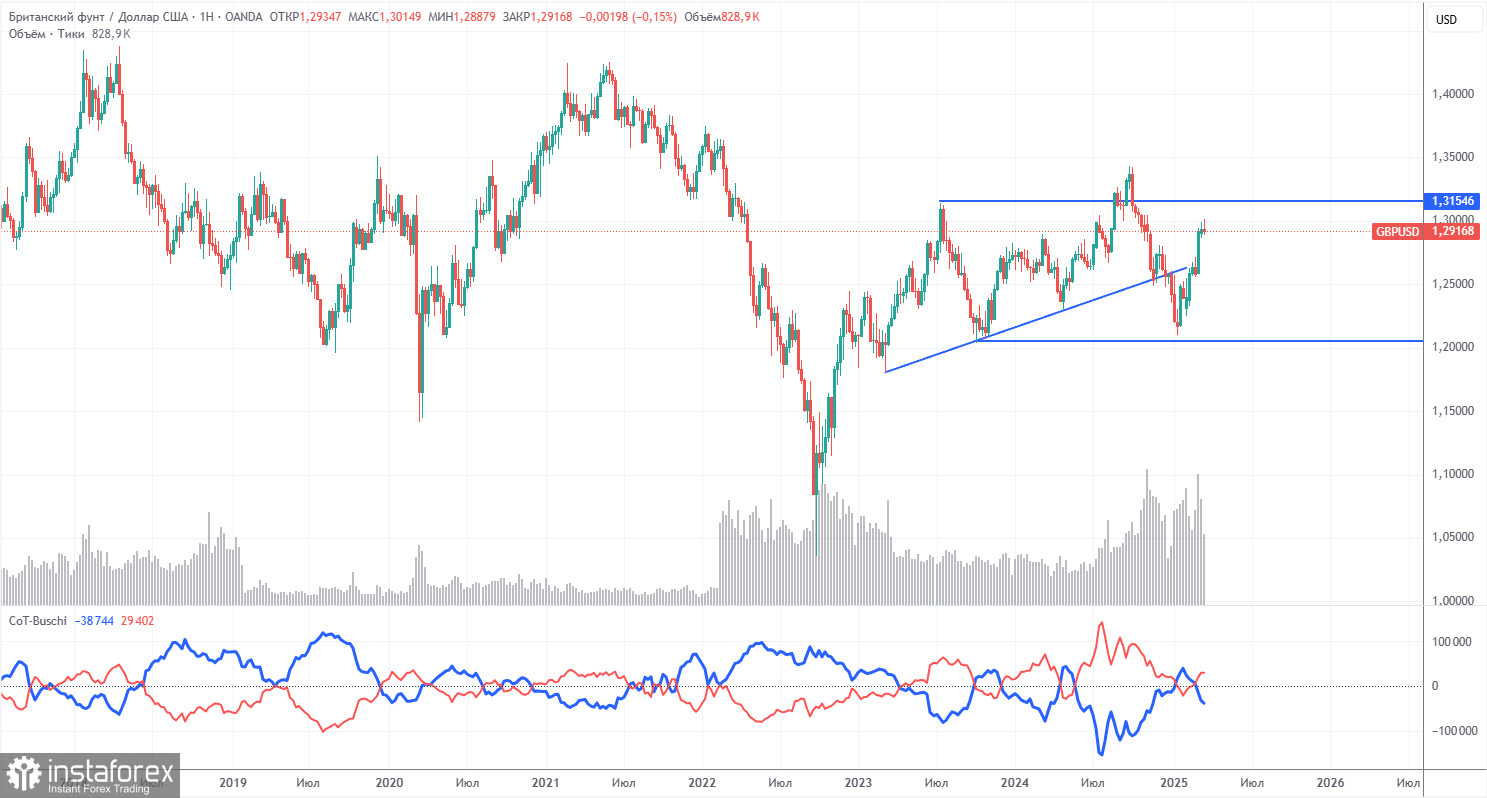
COT reports on the British pound show that commercial traders' sentiment has constantly changed in recent years. The red and blue lines, representing the net positions of commercial and non-commercial traders, intersect frequently and are mainly close to the zero level. They are also near each other, indicating that the number of long and short positions is roughly equal.
On the weekly chart, the price first broke the 1.3154 level and then dropped to the trendline, which it successfully breached. Breaking the trendline suggests that the pound is likely to continue falling. However, we should note a rebound from the second-to-last local low on the weekly chart. We may be dealing with a flat market.
According to the latest COT report on the British pound, the "Non-commercial" group opened 1,100 buy contracts and 900 sell contracts. As a result, the net position of non-commercial traders saw little change over the week.
The current fundamental backdrop does not support long-term buying of the pound, and the currency has a real possibility of continuing its global downward trend. The recent sharp increase in the pound's value can be attributed solely to Donald Trump's policies.
GBP/USD 1-Hour Analysis
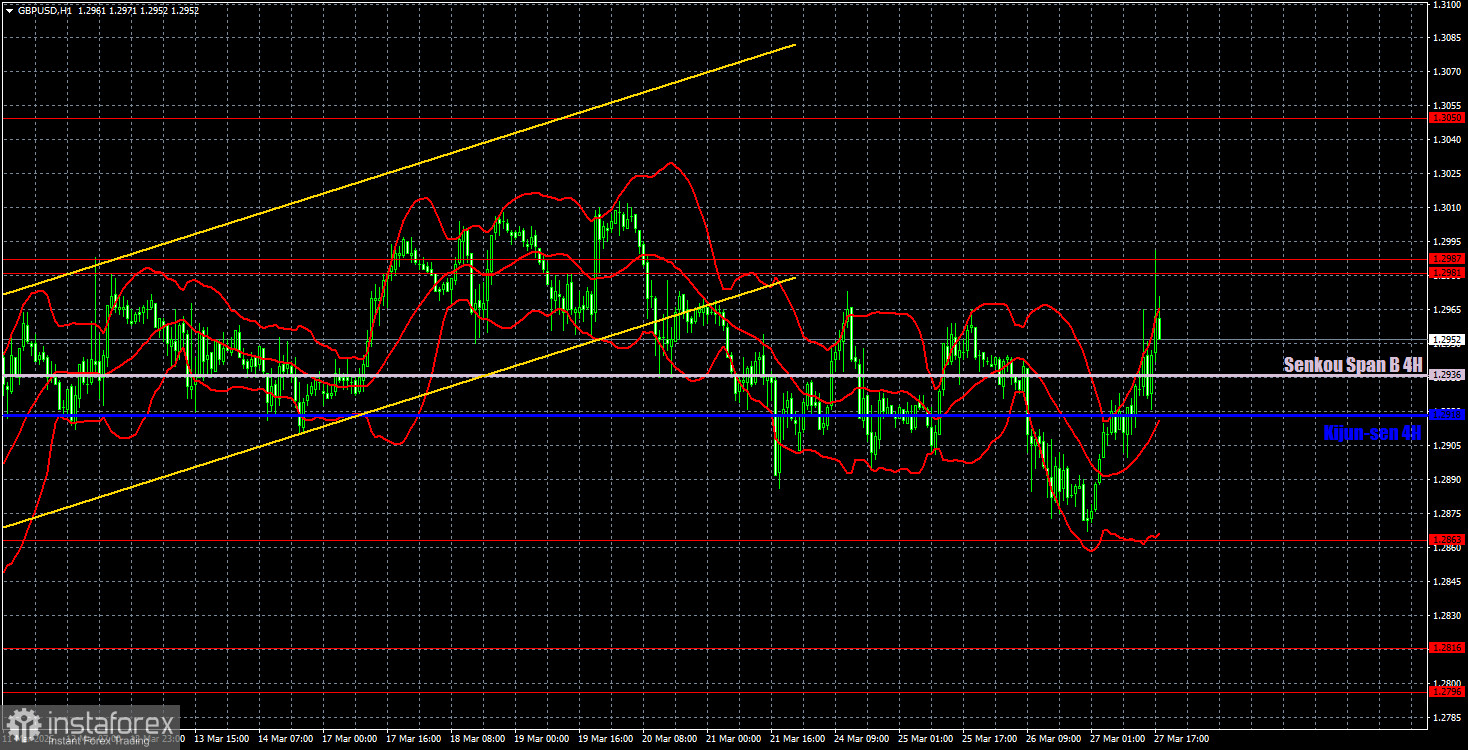
On the hourly timeframe, GBP/USD has initiated a downward move but remains weak. Meanwhile, the upward correction on the daily chart is long overdue to end. We still don't see any sustainable reason for the pound to rally in the long term. The only thing supporting the British currency is Donald Trump imposing sanctions and tariffs left and right. The market is ignoring all other factors. Even after a 650-pip rally, the pound still struggles to correct meaningfully.
For March 28, we highlight the following key levels: 1.2331–1.2349, 1.2429–1.2445, 1.2511, 1.2605–1.2620, 1.2691–1.2701, 1.2796–1.2816, 1.2863, 1.2981–1.2987, 1.3050, 1.3119. The Senkou Span B (1.2936) and Kijun-sen (1.2918) lines can also serve as signal zones. Moving your Stop Loss to breakeven once the price moves 20 pips in the right direction is recommended. The Ichimoku indicator lines may shift throughout the day and should be monitored accordingly for signal accuracy.
The UK will release retail sales data and the final Q4 GDP report on Friday. First, these reports are unlikely to support the pound. Second, the pound doesn't seem to need support at this point. Third, the market is hardly reacting to macroeconomic data at all. U.S. reports have even less chance of prompting a reaction.
Illustration Explanations:
- Support and Resistance Levels (thick red lines): Thick red lines indicate where movement may come to an end. Please note that these lines are not sources of trading signals.
- Kijun-sen and Senkou Span B Lines: Ichimoku indicator lines transferred from the 4-hour timeframe to the hourly timeframe. These are strong lines.
- Extreme Levels (thin red lines): Thin red lines where the price has previously bounced. These serve as sources of trading signals.
- Yellow Lines: Trendlines, trend channels, or any other technical patterns.
- Indicator 1 on COT Charts: Represents the net position size for each category of traders.