EUR/USD 5-Minute Analysis
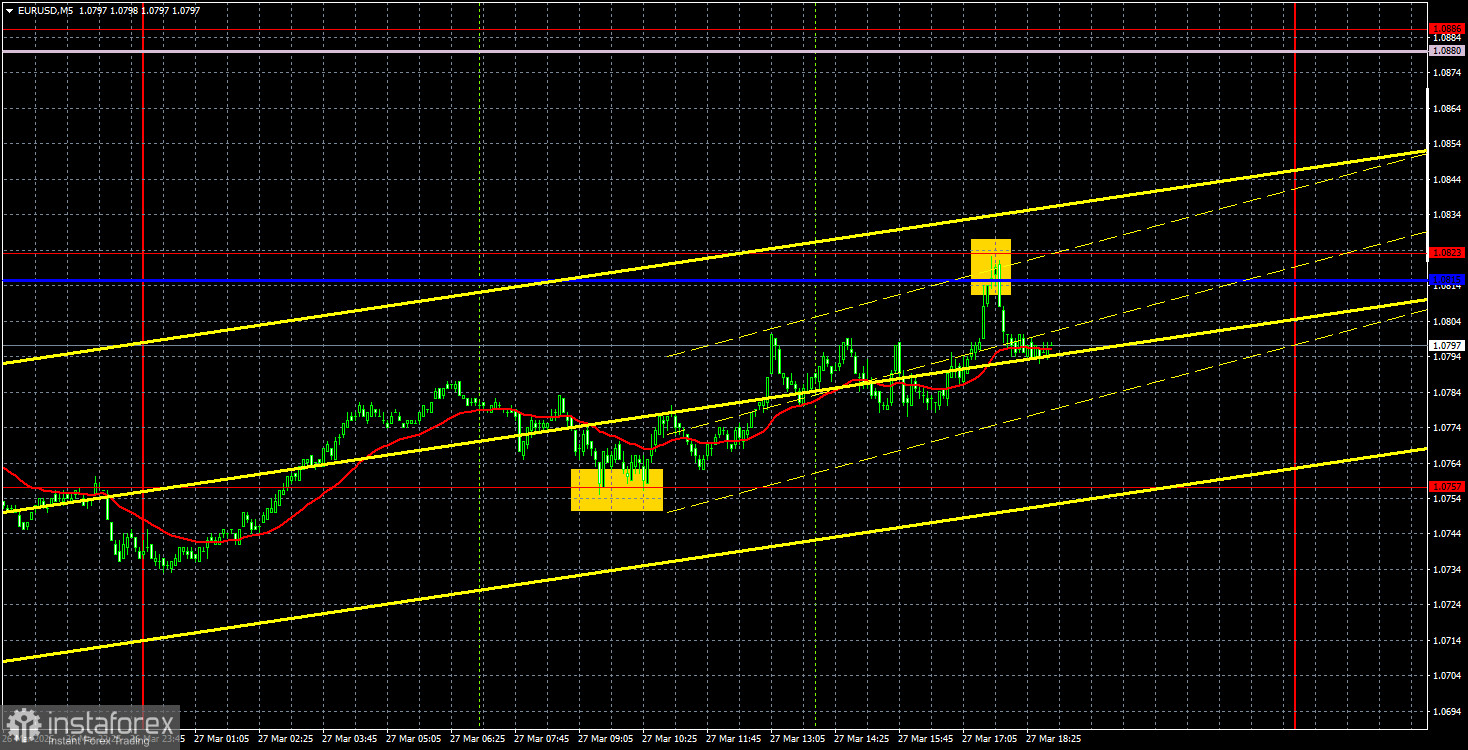
On Thursday, the EUR/USD currency pair surged sharply without breaking the prevailing downtrend of recent days. Valid reasons contributed to the dollar's decline after Donald Trump announced new tariffs on all countries exporting automobiles to the United States. As expected, the market responded with renewed dollar selling. This time, the U.S. currency did not collapse, which indicates progress. However, the U.S. president once again created issues for the dollar, and it remains uncertain how many more such episodes will occur. On April 2, Trump may announce new tariffs, potentially against the EU, so the dollar could fall again next week.
We must also remember that important U.S. economic data is due next week. If the reports are weaker than expected, the dollar may decline further. Yesterday, the final Q4 U.S. GDP report showed a higher-than-expected figure. How much did the dollar increase following that news? Not at all.
On the other hand, Thursday's trading signals were excellent. First, the price bounced precisely from the 1.0757 level, then responded accurately to the 1.0815–1.0823 area with another bounce. This allowed traders to open long positions in the morning and close them in the evening. The profit amounted to at least 40 pips.
COT Report
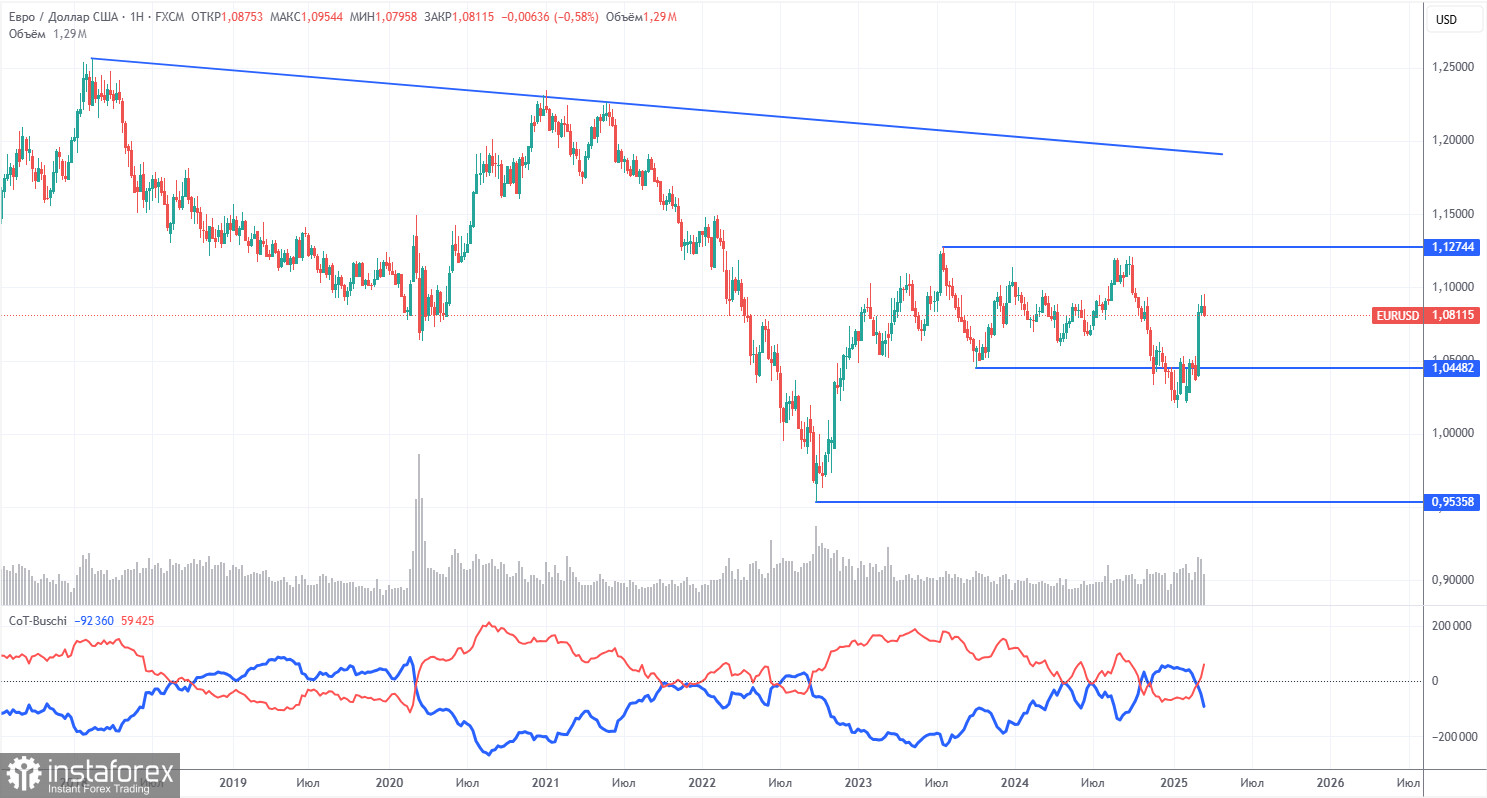
The latest Commitment of Traders (COT) report is dated March 18. As shown in the illustration, the net position of non-commercial traders remained bullish for a long time. The bears only recently gained a slight advantage, but now the bulls are back in control. Bearish positioning has quickly eroded since Trump assumed office and the dollar collapsed. We can't definitively say the dollar's decline will continue, and COT data reflects the sentiment of large players, which can shift rapidly in current conditions.
We still don't see any fundamental factors supporting euro strength, but there is now one powerful reason for dollar weakness. The pair may continue to correct for several weeks or months, but the 16-year downtrend won't reverse quickly.
Currently, the red and blue lines have crossed again, indicating a bullish trend. In the most recent reporting week, the number of long positions in the non-commercial group increased by 300 contracts, while the number of short positions fell by 46,000 contracts. As a result, the net position rose by 45,700 contracts.
EUR/USD 1-Hour Analysis
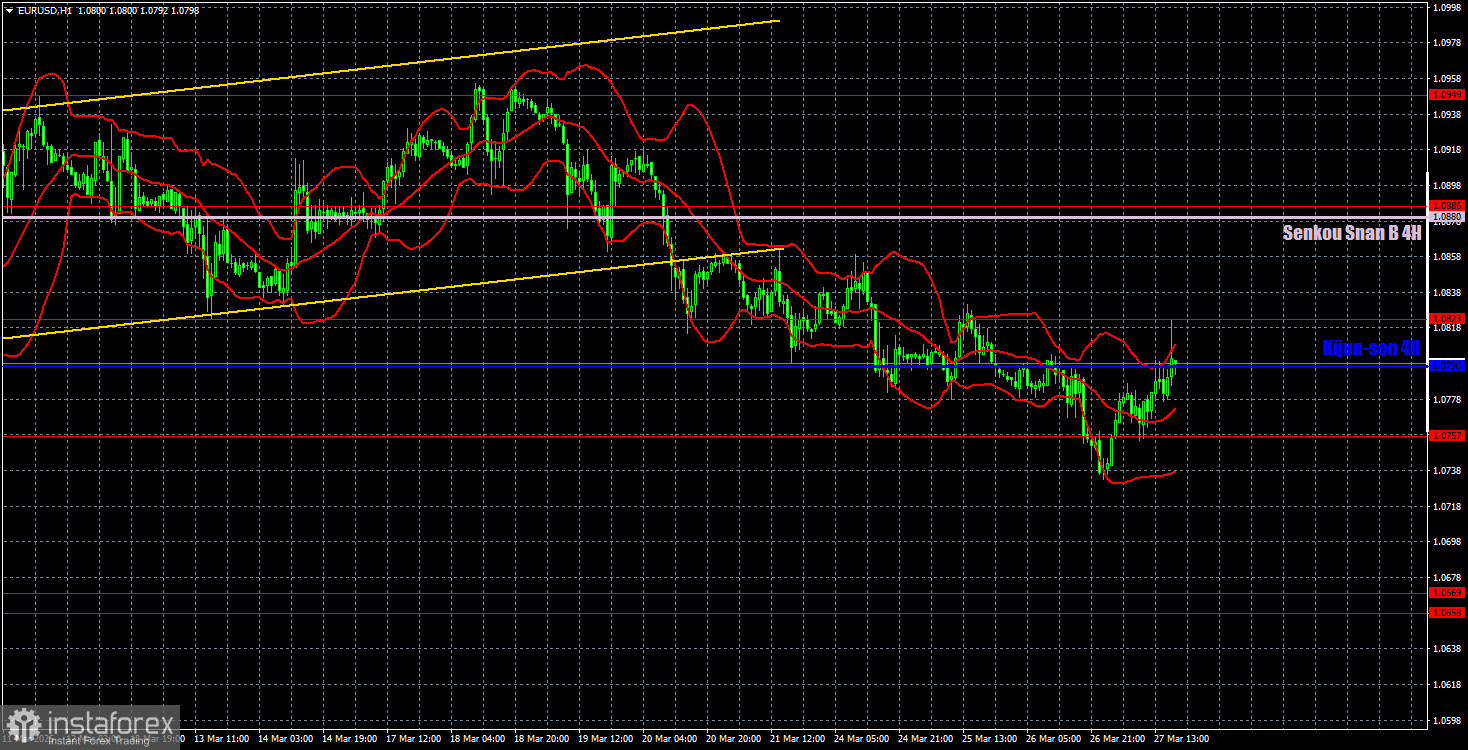
In the hourly timeframe, EUR/USD still leans toward a decline, which we fully support. Although the drop is weak and corrective, Trump continues to disrupt the dollar's momentum. We believe the decline will resume in the medium term due to the policy divergence between the ECB and the Fed, but it's unclear how long the market will continue reacting only to the "Trump factor." Traders are ignoring many news items and reports; the dollar is being sold off at every opportunity and can't rise even when there are solid reasons for it.
For March 28, we highlight the following trading levels: 1.0340–1.0366, 1.0461, 1.0524, 1.0585, 1.0658–1.0669, 1.0757, 1.0797, 1.0823, 1.0886, 1.0949, 1.1006, 1.1092, along with the Senkou Span B line (1.0880) and Kijun-sen line (1.0796). The Ichimoku indicator lines may shift during the day, which should be considered when determining trading signals. Also, don't forget to place a Stop Loss at breakeven if the price moves 15 pips in the correct direction — this will help minimize losses if the signal turns out to be false.
On Friday, Germany's unemployment report will be released in the eurozone, and in the U.S., we'll see the PCE index, personal income/spending figures, and the University of Michigan consumer sentiment index. All four reports are secondary. While they may trigger short-term market reactions, intraday trends, and overall market sentiment will remain the primary drivers.
Illustration Explanations:
- Support and Resistance Levels (thick red lines): Thick red lines indicate where movement may come to an end. Please note that these lines are not sources of trading signals.
- Kijun-sen and Senkou Span B Lines: Ichimoku indicator lines transferred from the 4-hour timeframe to the hourly timeframe. These are strong lines.
- Extreme Levels (thin red lines): Thin red lines where the price has previously bounced. These serve as sources of trading signals.
- Yellow Lines: Trendlines, trend channels, or any other technical patterns.
- Indicator 1 on COT Charts: Represents the net position size for each category of traders.