On Wednesday, the EUR/USD currency pair continued trading with minimal volatility and a slight downward bias. Trading volumes were absent, which is unsurprising—there has been very little news this week and even fewer important events. The market is already focused on next week, when not only will Donald Trump announce new import tariffs, but key data on U.S. labor and unemployment will also be released. And that's not even the full list of major upcoming events.
Again, there's no need to emphasize how important U.S. labor and unemployment data is. These figures are critical for the Federal Reserve in determining monetary policy. If the labor market shows significant weakness and the unemployment rate consistently increases, the Federal Reserve will need to lower the key interest rate to avoid more serious issues. It's no secret that a tight monetary policy cools the economy and the labor market. So, while these data are fundamentally important, the market treats them as practically irrelevant.
Traders are currently focused exclusively on Donald Trump's trade tariffs, which precisely caused the U.S. dollar to plummet in recent weeks. Next week, the countries facing the new sanctions and their volume will finally be revealed.
Before his inauguration, Trump began discussing tariffs, so markets expected the worst-case scenario. However, over the past week, insider information has emerged suggesting that Trump may be softening his stance. The U.S. president may now introduce less "harsh" tariffs than initially planned—possibly only targeting countries with large trade deficits with the U.S. and implementing selective rather than broad measures. In any case, this suggests Trump's more moderate approach.
In our view, Trump is backtracking. The past two months have demonstrated that only economically weaker countries are willing to meet Trump's demands. Stronger players—such as the European Union, Canada, and China—impose retaliatory sanctions. Leaders in Beijing, Brussels, and Ottawa understand that while tariffs will hurt, they are unwilling to bow to Washington, knowing that giving in once will only encourage Trump to keep applying pressure and making more demands.
As of late March, we believe Trump realizes his strategy hasn't worked. If he imposes sweeping tariffs, the U.S. will continue to suffer. Much of the world is already boycotting American goods, the stock market is declining, the dollar is depreciating, and relationships with key neighbors and trade partners are deteriorating. The best action for Trump is to introduce "light" tariffs and pretend he respects other nations and is willing to negotiate, not just issue ultimatums.
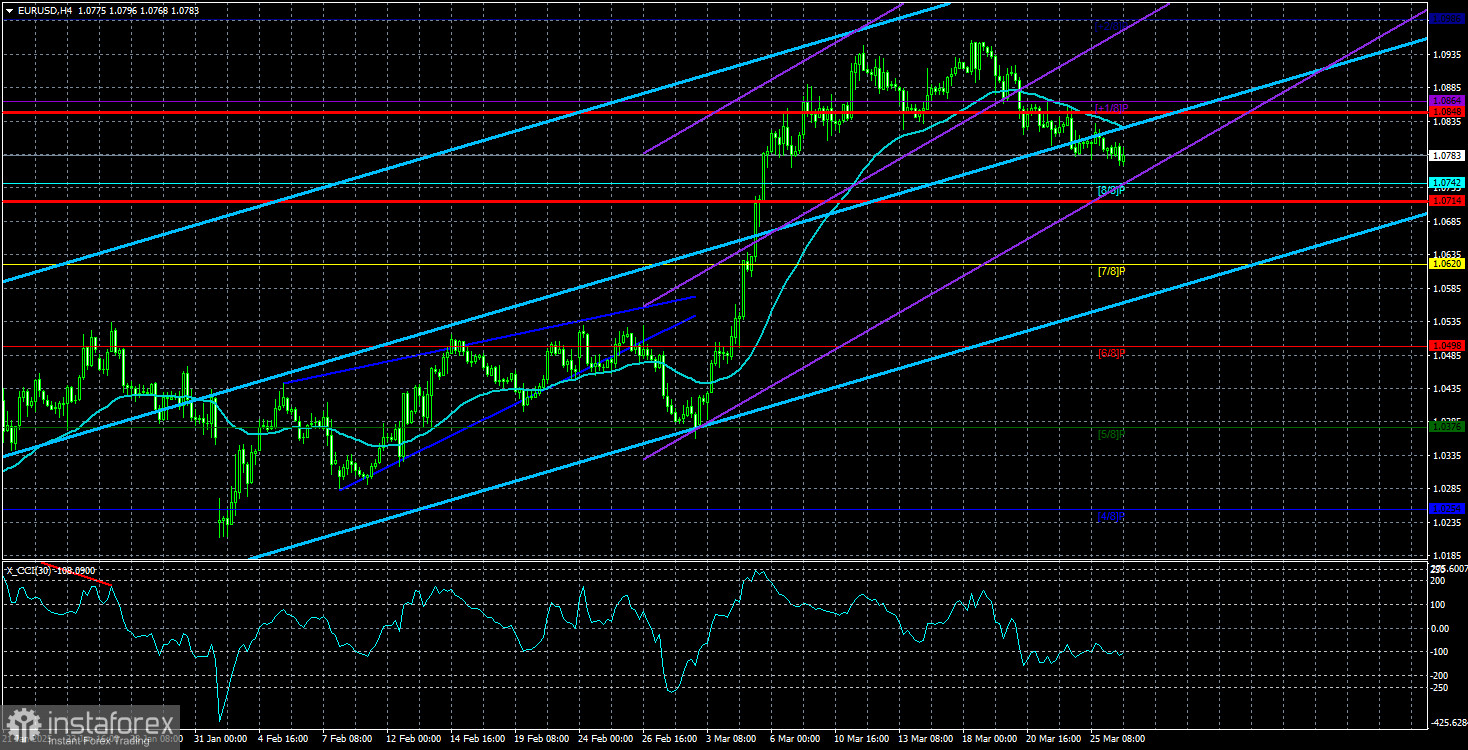
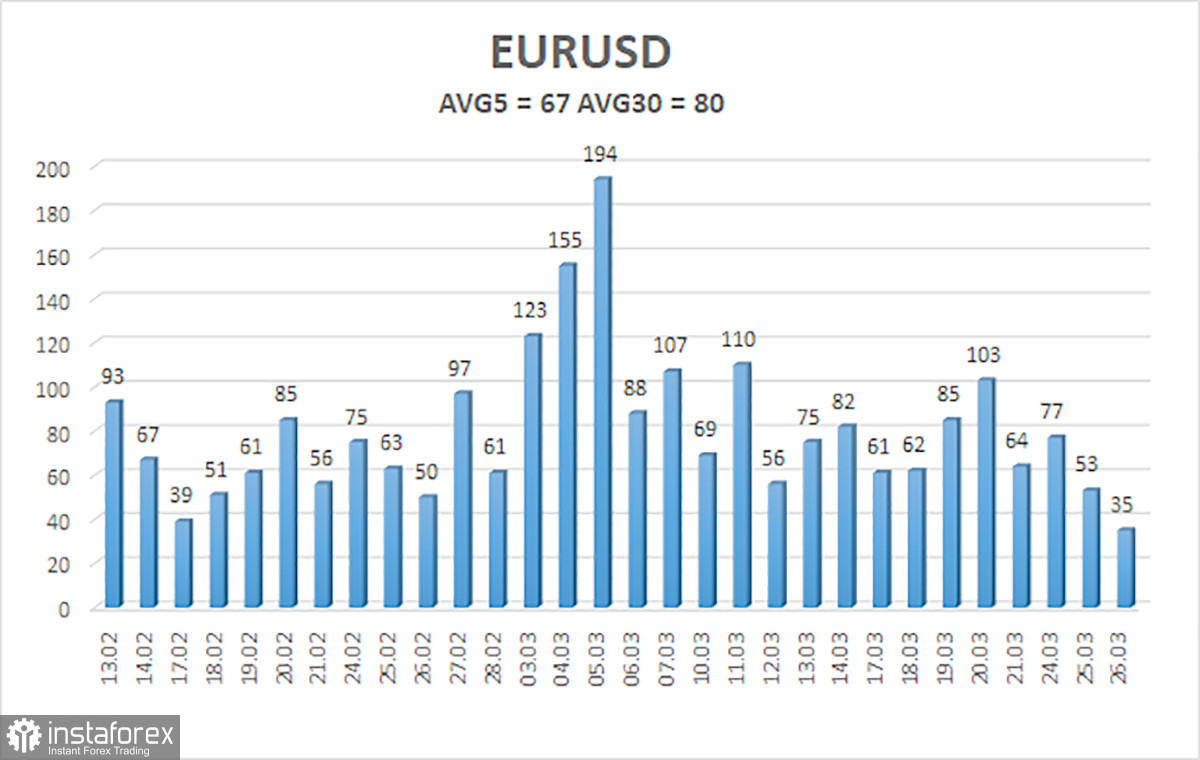
The average volatility of the EUR/USD currency pair over the last five trading days (as of March 27) is 67 pips, which is considered "moderate." We expect the pair to trade between 1.0714 and 1.0848 on Thursday. The long-term regression channel has turned upward, but the global downtrend remains intact, as seen in higher timeframes. The CCI indicator has not recently entered overbought or oversold territory.
Nearest Support Levels:
S1 – 1.0742
S2 – 1.0620
S3 – 1.0498
Nearest Resistance Levels:
R1 – 1.0864
R2 – 1.0986
Trading Recommendations:
EUR/USD continues a weak downward correction. For several months, we have consistently maintained that a medium-term decline in the euro is the most likely scenario—and nothing has changed. The U.S. dollar still has no reason for a medium-term drop apart from Donald Trump. Short positions remain much more attractive, with targets at 1.0315 and 1.0254, though it's difficult to say when the illogical upward move will end. If you trade purely based on technicals, long positions can be considered if the price rises above the moving average, targeting 1.0986.
Explanation of Illustrations:
Linear Regression Channels help determine the current trend. If both channels are aligned, it indicates a strong trend.
Moving Average Line (settings: 20,0, smoothed) defines the short-term trend and guides the trading direction.
Murray Levels act as target levels for movements and corrections.
Volatility Levels (red lines) represent the likely price range for the pair over the next 24 hours based on current volatility readings.
CCI Indicator: If it enters the oversold region (below -250) or overbought region (above +250), it signals an impending trend reversal in the opposite direction.