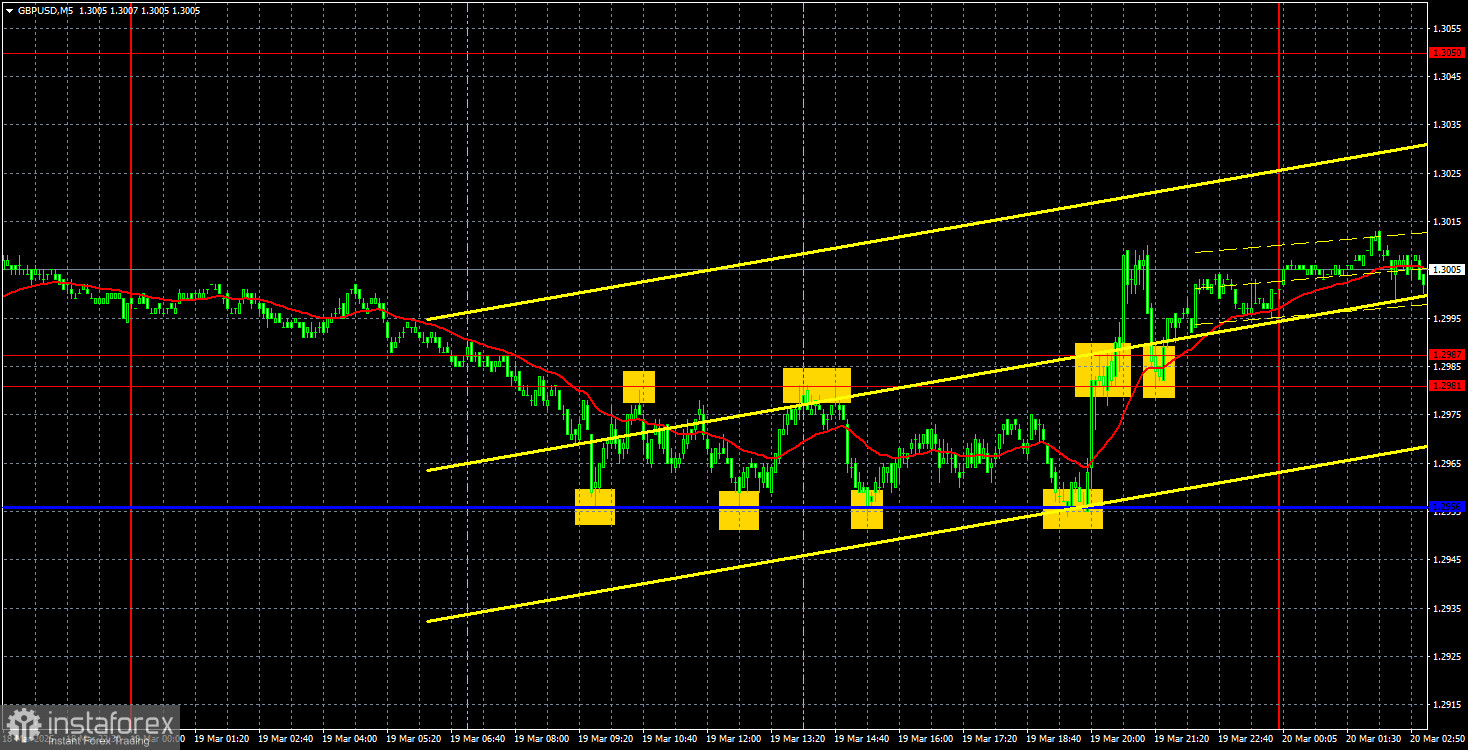
GBP/USD 5-Minute Analysis
The GBP/USD currency pair continued to trade within the same range on Wednesday. Despite the Fed meeting, Jerome Powell's speech, and the updated dot-plot, the market saw no significant movements. Before the Fed's decision, GBP/USD was trading near the lower boundary of the ascending channel, and the only movement that occurred was a minor increase within the same channel. In other words, the Fed meeting did not change the market behavior, as the pair moved the same way as before.
The U.S. dollar declined once again, which was expected. However, there is one major issue—the dollar has been falling for weeks, often without any apparent reason. Frankly, even considering Donald Trump's tariffs and their negative impact on the U.S. economy, the dollar should have stopped falling by now. At the very least, a correction is due, and a clearer trading strategy can be formed.
Today, the Bank of England will hold its policy meeting, which means increased volatility is likely. Wednesday's volatility was not particularly high, so we assume the market has not fully reacted to the Fed's decision yet. Surprises are possible for the BoE, so we prefer to wait for the official announcement before drawing conclusions.
Before the Fed meeting, GBP/USD was trading in a tight 35-pip range between the Kijun-sen line and the 1.2981 level. Six bounce signals were formed within this range, and any of them could have been traded profitably. However, due to low volatility, profits were limited. Two additional buy signals emerged after the Fed's decision, but given the high level of risk, we opted to avoid such uncertain setups.
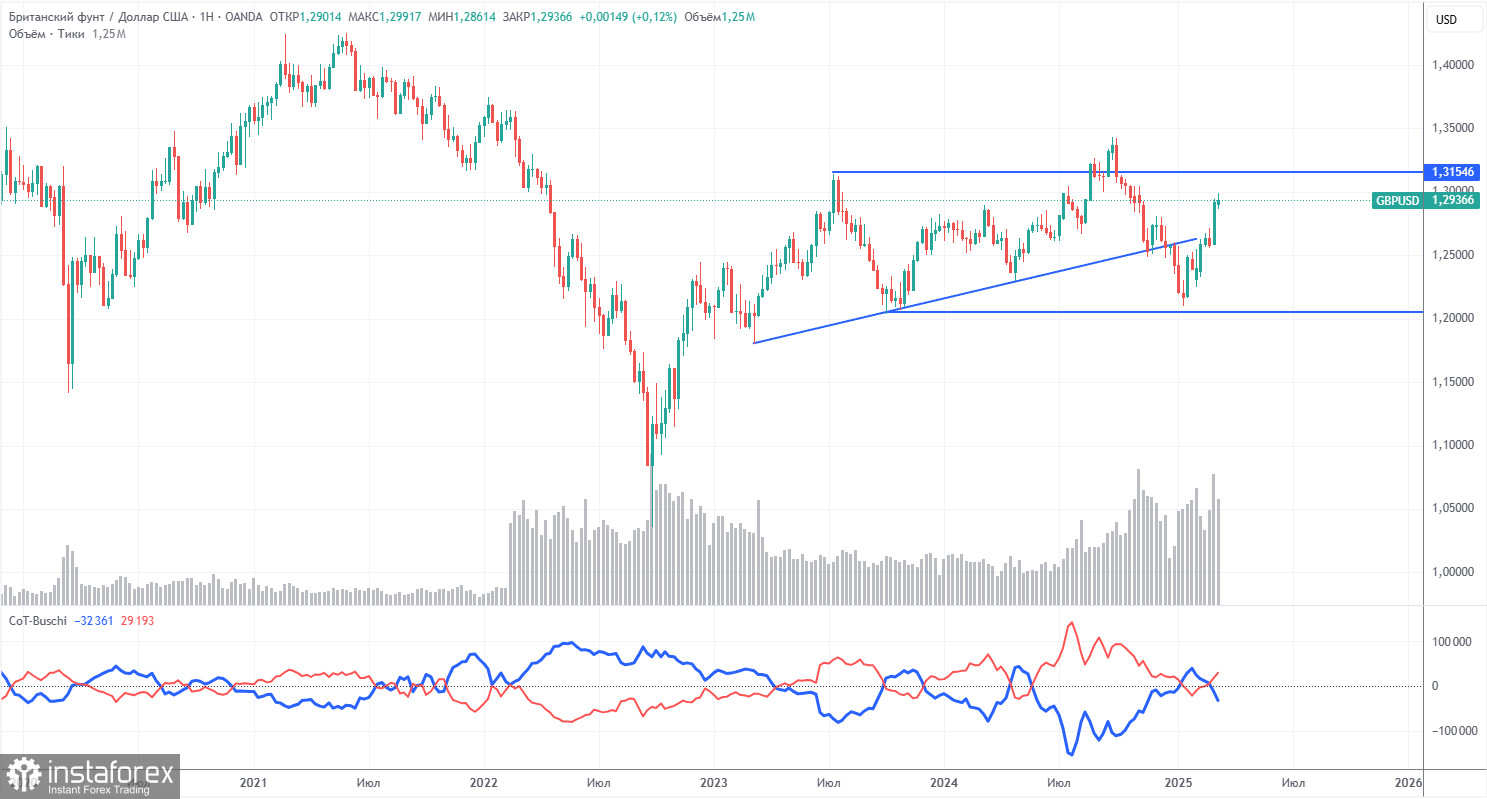
COT Report
COT reports on the British pound indicate that sentiment among commercial traders has been fluctuating over recent years. The red and blue lines, which represent the net positions of commercial and non-commercial traders, frequently intersect and typically hover around the zero mark. Currently, they are close to each other, suggesting a roughly equal number of buy and sell positions.
On the weekly timeframe, the price initially broke through the 1.3154 level before dropping to the trend line, which it subsequently breached. This break suggests that the pound is likely to continue its decline. However, there was also a rebound from the second-to-last local low on the weekly chart, indicating that the market might be entering a period of sideways movement.
According to the latest report on the British pound, the non-commercial group opened 12,900 BUY contracts and 2,300 SELL contracts. Consequently, the net position of non-commercial traders increased by 10,600 contracts over the week.
The fundamental background still does not provide justification for long-term purchases of the British pound. The currency may continue its global downward trend. While the pound has risen significantly in recent times, this increase can be attributed largely to Donald Trump's policies.
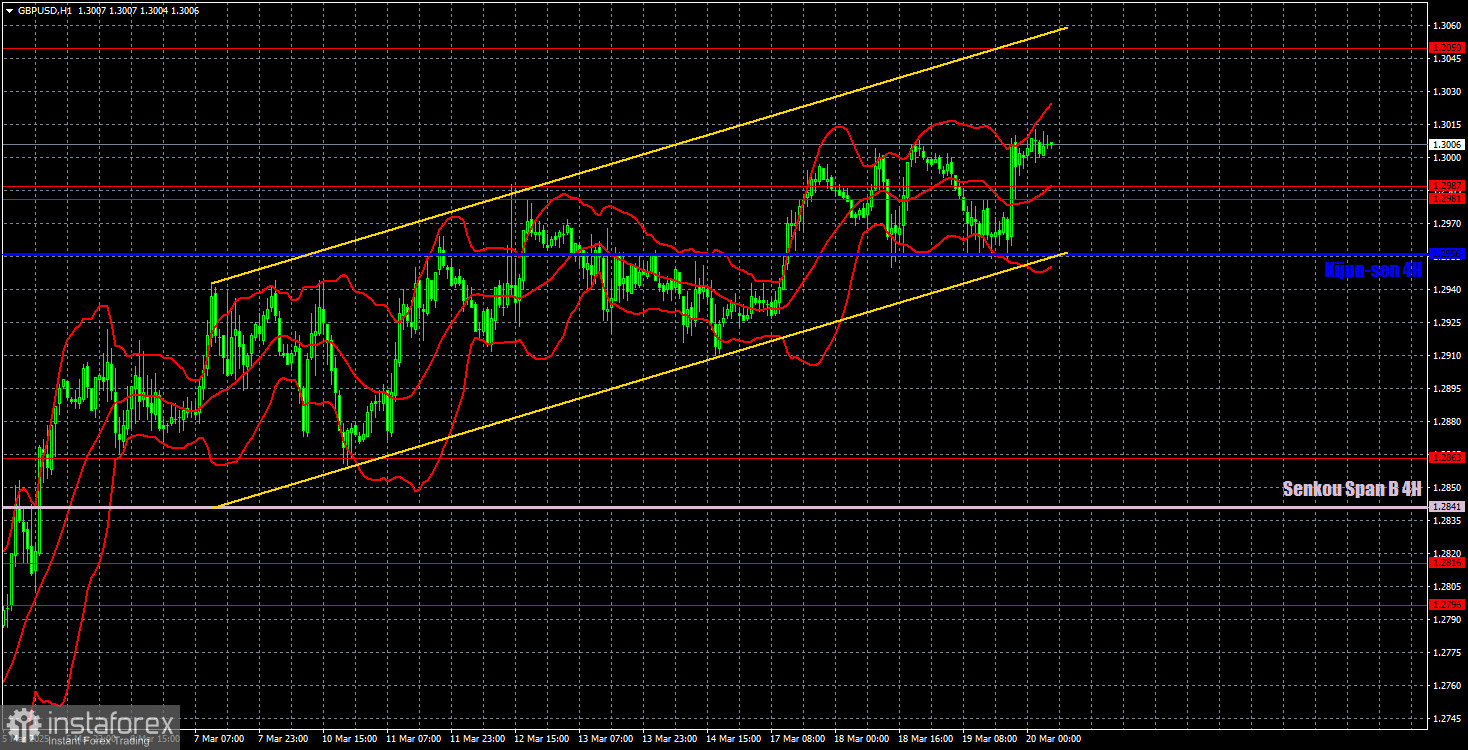
GBP/USD 1-Hour Analysis
On the hourly timeframe, GBP/USD remains in an uptrend. The pair traded sideways for several days but now appears ready to resume its upward movement. A correction is long overdue on the daily timeframe, and we still do not see a strong fundamental reason for the pound's long-term growth. The only factor supporting the GBP is Donald Trump, who continues introducing new tariffs and sanctions. Even when no new sanctions are imposed, the dollar still weakens. The market seems to ignore other economic factors and focus only on U.S. political events.
For March 20, we highlight the following important levels: 1,2331-1,2349, 1,2429-1,2445, 1,2511, 1,2605-1,2620, 1,2691-1,2701, 1,2796-1,2816, 1,2863, 1,2981-1,2987, 1,3050, 1,3119. Senkou Span B (1.2841) and Kijun-sen (1.2956) lines can also be sources of signals. Setting the Stop Loss to breakeven when the price passes 20 pips in the right direction is recommended. The lines of the Ichimoku indicator may move during the day, which should be considered when determining trading signals.
The BoE meeting is the most important event of the day and could trigger major market moves. Meanwhile, in the U.S., no significant reports are expected, meaning that technical analysis will play a crucial role. If GBP/USD breaks below the ascending channel, it could signal the end of the pound's strong rally and mark the beginning of a correction.
Illustration Explanations:
- Support and Resistance Levels (thick red lines): Thick red lines indicate where movement may come to an end. Please note that these lines are not sources of trading signals.
- Kijun-sen and Senkou Span B Lines: Ichimoku indicator lines transferred from the 4-hour timeframe to the hourly timeframe. These are strong lines.
- Extreme Levels (thin red lines): Thin red lines where the price has previously bounced. These serve as sources of trading signals.
- Yellow Lines: Trendlines, trend channels, or any other technical patterns.
- Indicator 1 on COT Charts: Represents the net position size for each category of traders.