empty
10.02.2025 08:10 AM
Trading Recommendations and Trade Analysis for EUR/USD on February 10th

EUR/USD 5-Minute Chart Analysis

This image is no longer relevant

The EUR/USD pair demonstrated logical price movements on Friday, although the US dollar ultimately strengthened by the end of the day. However, its gains were not particularly strong, as US macroeconomic data was not entirely positive.

The Nonfarm Payrolls (NFP) report for January showed only 143K new jobs, falling short of the minimum expected 170K. However, the December figure was revised up to 307K, making the overall report decent. The unemployment rate unexpectedly dropped to 4%, a result nobody anticipated. However, the University of Michigan Consumer Sentiment Index declined to 67.8 points, which is a negative signal. Overall, stronger labor market data outweighed weaker sentiment readings, but the US dollar failed to post a significant rally, which was a logical outcome.

From a technical standpoint, the hourly chart remains unchanged. The recent local downtrend ended, the trendline was broken, and a correction began, just as expected.

For the new week, we anticipate a new upward wave, as the correction on the daily timeframe is still weak. Corrections can be complex, often appearing as either a minor trend or a sideways movement. Currently, the daily and H4 charts suggest more of a choppy market structure rather than a clear trend.

On the 5-minute timeframe, several trading signals emerged on Friday, but none were worth executing. The first signal formed during the US trading session, coinciding with the release of employment data. During such periods, it is risky to enter trades due to heightened market volatility. Later, the pair consolidated within the 1.0327–1.0366 range, where it remained until the market closed.

Commitments of Traders (COT) Report

The latest COT report (February 4) confirms the bearish shift in market sentiment. The net position of non-commercial traders (hedge funds, speculators) had remained bullish for a long time, but bears eventually took control. Two months ago, the number of short positions held by institutional traders increased sharply, turning the net position negative for the first time in a long time. This indicates that the euro is now being sold more frequently than bought.

We still see no fundamental factors supporting a long-term recovery of the euro. The recent upward movement on the weekly chart is barely noticeable, suggesting it was just a correction. The 16-year-long downward trend remains intact. The red and blue lines in the COT report have crossed, signaling a shift to bearish sentiment.

During the last reporting week, long positions (buy trades) in the Non-commercial group increased by 8.9K contracts. Short positions (sell trades) rose by only 0.9K contracts. As a result, the net position increased by 8K contracts, but this did not impact the overall bearish trend.

EUR/USD H1 Chart Analysis

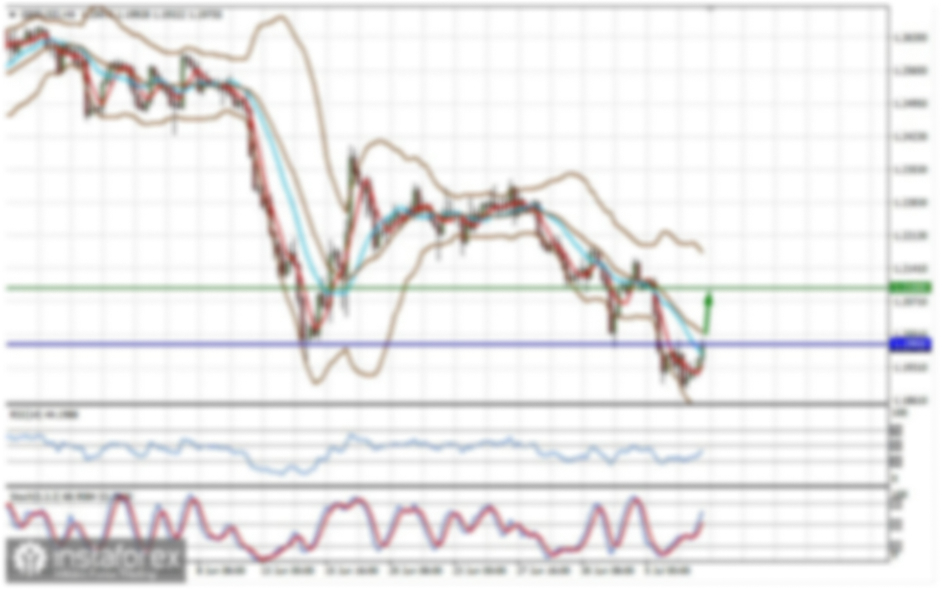
On the hourly timeframe, the local downtrend has ended, as the downward trendline was broken. We expect further declines in the medium term, as the Federal Reserve may only cut rates 1–2 times in 2025, which is a much more hawkish outlook than markets had anticipated. However, in the short term, we may see one or two more upward waves before the downtrend resumes. Fundamentally, the euro still lacks strong bullish drivers, but technical corrections are taking place.

On February 10, the following levels are highlighted for trading: 1.0124, 1.0195, 1.0269, 1.0340–1.0366, 1.0461, 1.0524, 1.0585, 1.0658–1.0669, 1.0757, 1.0797, 1.0843, as well as the Senkou Span B (1.0372) and Kijun-sen (1.0340)

Ichimoku indicator lines may shift during the day, so traders should adjust accordingly. Always set a Stop Loss to breakeven if the price moves 15 points in the correct direction, to minimize risk from false breakouts.

The only major scheduled event is a speech by ECB President Christine Lagarde. However, this is expected to be a formal event with little market impact, as the ECB meeting concluded recently and already provided all necessary policy insights.

Chart Explanations

  • Thick red lines – major support and resistance levels where price reversals may occur.
  • Ichimoku indicator lines (Kijun-sen, Senkou Span B) – Strong support/resistance levels from the 4-hour chart.
  • Thin red lines – extreme levels where price has previously bounced. These serve as potential trade signals.
  • Yellow lines – trendlines, channels, and other technical formations.
  • COT Indicator (on charts) – Shows the net position of each trader category.
Paolo Greco,
Analytical expert of InstaForex
© 2007-2025
Select timeframe
5
min
15
min
30
min
1
hour
4
hours
1
day
1
week
Earn on cryptocurrency rate changes with InstaForex
Download MetaTrader 4 and open your first trade
  • Grand Choice
    Contest by
    InstaForex
    InstaForex always strives to help you
    fulfill your biggest dreams.
    JOIN CONTEST

Recommended Stories

How to Trade the GBP/USD Pair on March 18? Simple Tips and Trade Analysis for Beginners

Analysis of Monday's Trades 1H Chart of GBP/USD On Monday, the GBP/USD pair also attempted to resume its upward movement and even broke through the latest local high within

Paolo Greco 06:08 2025-03-18 UTC+2

How to Trade the EUR/USD Pair on March 18? Simple Tips and Trade Analysis for Beginners

Analysis of Monday's Trades 1H Chart of EUR/USD On Monday, the EUR/USD currency pair resumed its upward movement but remained within a sideways channel between the levels of 1.0804

Paolo Greco 06:08 2025-03-18 UTC+2

Trading Recommendations and Analysis for GBP/USD on March 18: The British Pound is Flying North Again

On Monday, the GBP/USD currency pair again showed an upward movement despite having no reason. The market continues to buy the British pound purely out of inertia, much like Bitcoin

Paolo Greco 02:35 2025-03-18 UTC+2

Trading Recommendations and Analysis for EUR/USD on March 18: A New Increase, But Within Reasonable Limits

The EUR/USD currency pair continued to trade higher on Monday but within a confined range that can be considered a sideways channel. Traders again ignored all news supporting the U.S

Paolo Greco 02:35 2025-03-18 UTC+2

GBP/USD: Trading Plan for the U.S. Session on March 17th (Review of Morning Trades)

In my morning forecast, I highlighted 1.2949 as a key level for making market entry decisions. Let's analyze the 5-minute chart to see what happened. The price moved higher

Miroslaw Bawulski 17:20 2025-03-17 UTC+2

EUR/USD: Trading Plan for the U.S. Session on March 17th (Review of Morning Trades)

In my morning forecast, I highlighted the 1.0866 level as a key point for making entry decisions. Let's look at the 5-minute chart to analyze what happened. A decline

Miroslaw Bawulski 17:17 2025-03-17 UTC+2

Trading Recommendations and Analysis for GBP/USD on March 17: The Pound Shows No Interest in the Economy

The GBP/USD currency pair experienced a slight decline on Friday, with minimal volatility. In fact, the British currency has been falling for three consecutive days, losing a total

Paolo Greco 02:54 2025-03-17 UTC+2

Trading Recommendations and Analysis for EUR/USD on March 17: The Euro Remains Steady at Highs

The EUR/USD currency pair traded upward again on Friday, although no clear reasons emerged for this movement. The increase occurred during the European trading session, followed by a period

Paolo Greco 02:54 2025-03-17 UTC+2

How to Trade the GBP/USD Pair on March 17? Simple Tips and Trade Analysis for Beginners

Analysis of Friday's Trades 1H Chart of GBP/USD The GBP/USD pair continued to trade with low volatility on Friday, remaining within the sideways channel of 1.2913 to 1.2980

Paolo Greco 22:26 2025-03-16 UTC+2

How to Trade the EUR/USD Pair on March 17? Simple Tips and Trade Analysis for Beginners

Analysis of Friday's Trades 1H Chart of EUR/USD The EUR/USD currency pair experienced a brief surge on Friday; however, this rise was short-lived and not particularly strong. The increase

Paolo Greco 22:26 2025-03-16 UTC+2
Can't speak right now?
Ask your question in the chat.
Widget callback
 

Dear visitor,

Your IP address shows that you are currently located in the USA. If you are a resident of the United States, you are prohibited from using the services of InstaFintech Group including online trading, online transfers, deposit/withdrawal of funds, etc.

If you think you are seeing this message by mistake and your location is not the US, kindly proceed to the website. Otherwise, you must leave the website in order to comply with government restrictions.

Why does your IP address show your location as the USA?

  • - you are using a VPN provided by a hosting company based in the United States;
  • - your IP does not have proper WHOIS records;
  • - an error occurred in the WHOIS geolocation database.

Please confirm whether you are a US resident or not by clicking the relevant button below. If you choose the wrong option, being a US resident, you will not be able to open an account with InstaForex anyway.

We are sorry for any inconvenience caused by this message.