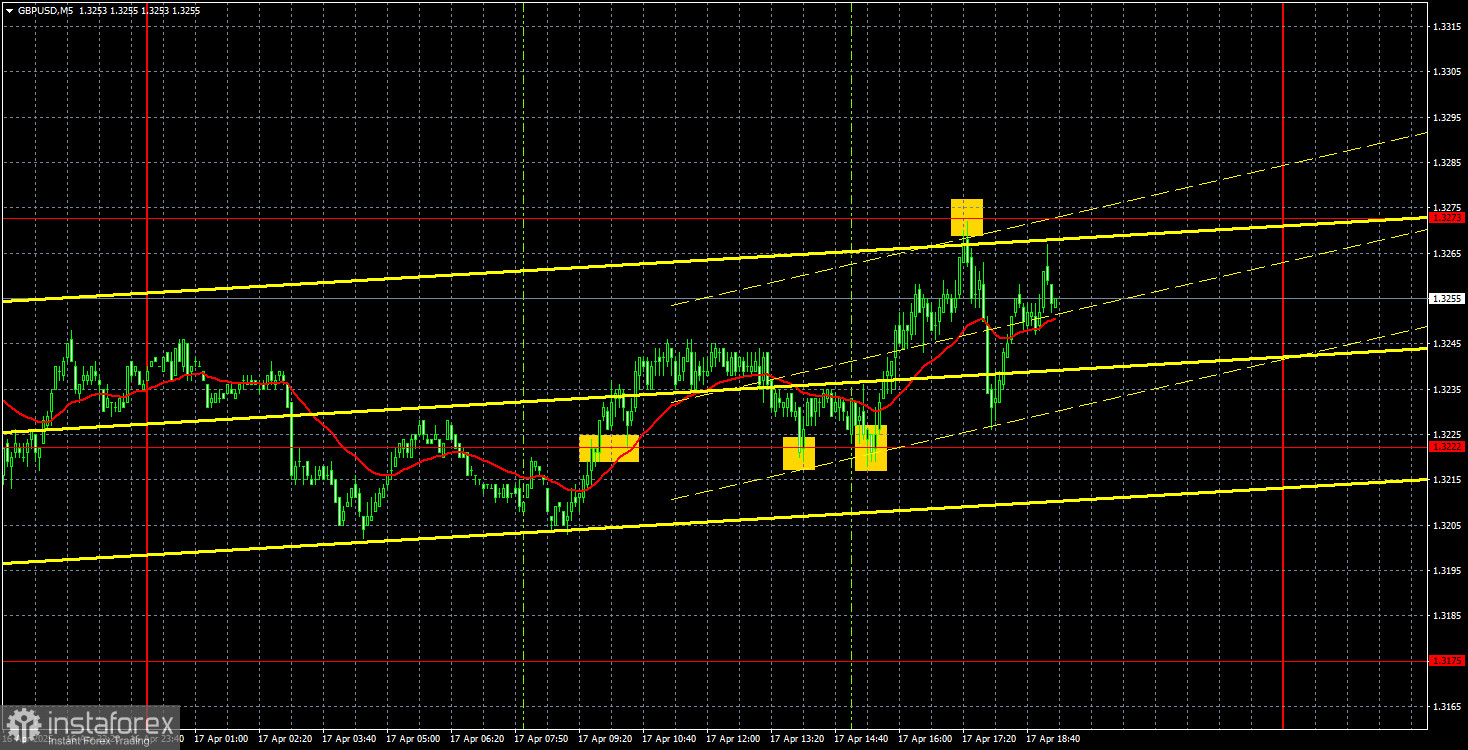
GBP/USD 5-Minute Analysis
The GBP/USD currency pair continued its upward movement on Thursday, trading near multi-year highs. Despite the lack of significant events in the U.S. or the U.K. (unlike Wednesday), the market persistently pushed the pound higher. Volatility, meanwhile, has been steadily declining almost every day. In other words, trader activity is falling, yet the pair continues to be steadily driven north. Such determination is admirable.
The U.K. released rather mediocre macroeconomic data this week. The unemployment rate remained unchanged, but wage growth slowed with headline and core inflation. Any inflation decline brings the Bank of England closer to its next round of monetary easing, which should logically lead to a drop in the pound. It should, but it doesn't have to. On Thursday, we saw that the European Central Bank's rate cut didn't trigger any notable decline in the euro. That's because the market continues to focus solely on Trump. Market movements are minimal when there's no news from the White House.
Strangely enough, on Thursday, the pound showed rather technical price action. The price consolidated above the 1.3222 level, then bounced precisely off this level twice. It then tested the 1.3273 level just as accurately and rebounded downward. As such, traders could have entered long positions first, followed by short ones. The long trade could have yielded a 30-pip profit, while the short trade likely didn't reach its target at 1.3222, so profits there were less likely.
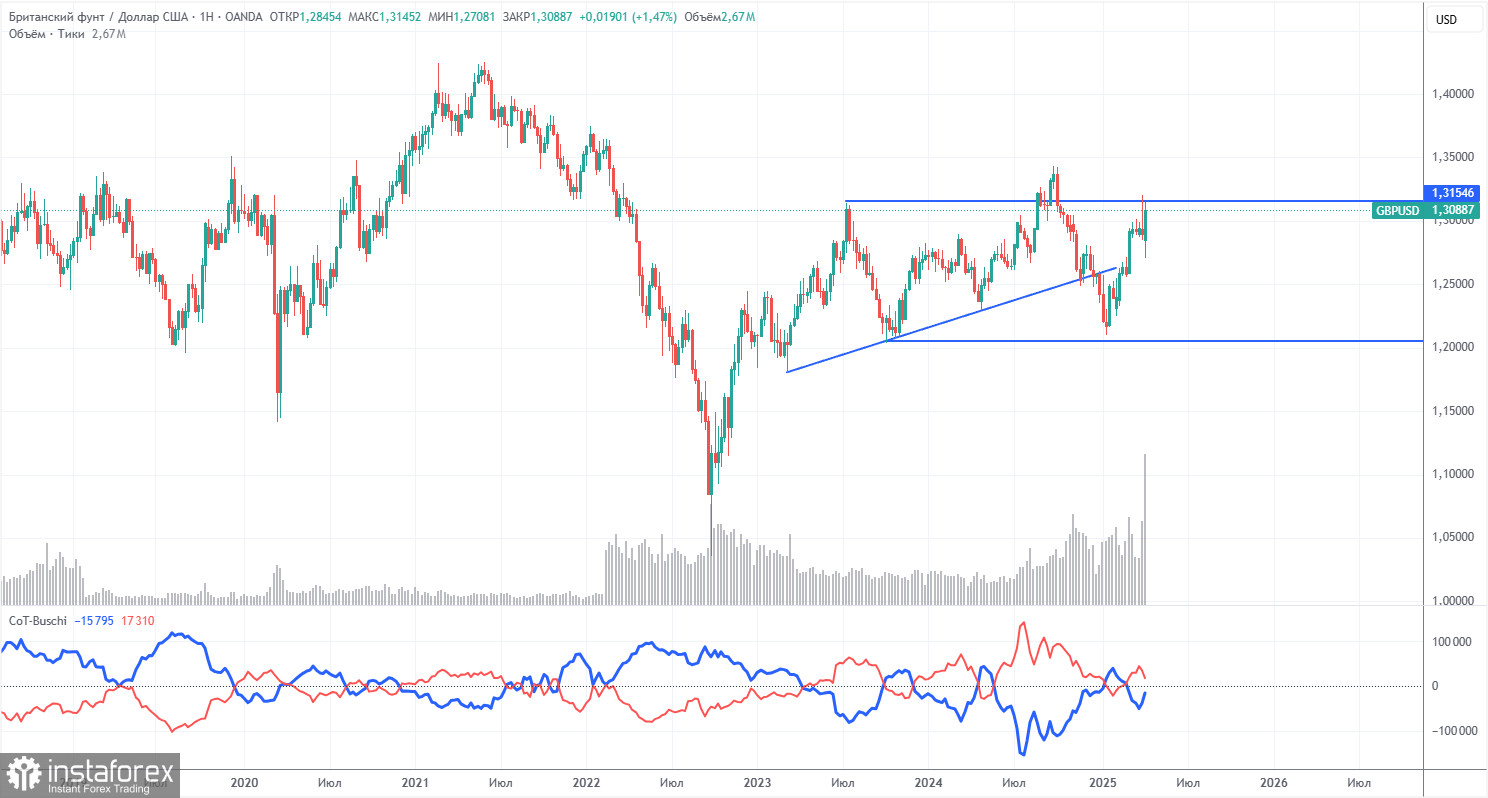
COT Report
COT (Commitments of Traders) reports on the British pound show that commercial traders' sentiment has constantly shifted in recent years. The red and blue lines, representing net positions of commercial and non-commercial traders, frequently cross and often stay close to the zero line. They're also close together, suggesting a roughly equal balance between long and short positions.
On the weekly time frame, the price initially broke through the 1.3154 level, then breached the trendline, returned to 1.3154, and bounced off. Breaking the trendline suggests the pound is likely to continue declining, and the bounce off 1.3154 increases the chances of this bearish scenario. On the weekly chart, everything again points to the pound preparing for a downward move.
According to the latest COT report on the British pound, the "non-commercial" group closed 13,200 BUY contracts and opened 4,000 SELL contracts. This means the net position of non-commercial traders has declined for the second week, this time by 17,200 contracts.
The fundamental backdrop still offers no justification for long-term pound purchases, and the currency remains at real risk of continuing a global downtrend. The pound has gained significantly lately, but the sole reason is Donald Trump's trade policy.
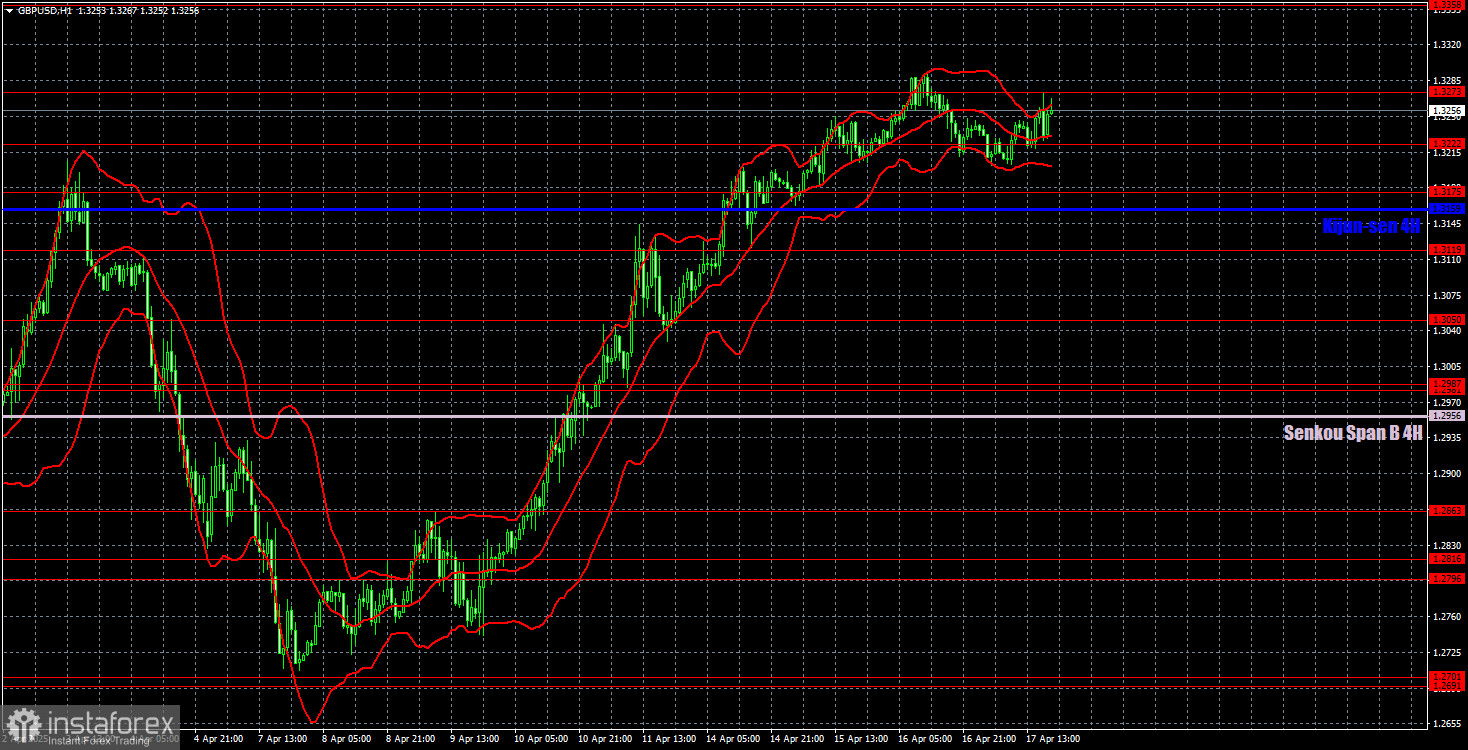
GBP/USD 1-Hour Analysis
On the hourly timeframe, the GBP/USD pair posted a strong surge after nearly a month of sideways trading, then experienced an even sharper drop, followed by another steep climb. The pound is rising again now, though there's little intrinsic justification. The entire move upward is a consequence of dollar weakness, triggered by Trump—and that move is not over yet. As a result, market chaos, panic, and randomness continue to prevail, and any clear logic or consistency in price action is absent.
On April 18, we highlight the following levels for trading - 1.0757, 1.0797, 1.0823, 1.0886, 1.0949, 1.1006, 1.1092, 1.1147, 1.1185, 1.1234, 1.1274, 1.1323, 1.1391, 1.1482, as well as the Senkou Span B (1.1126) and Kijun-sen (1.1348) lines. The lines of the Ichimoku indicator can move during the day, which should be considered when determining trading signals. Do not forget about placing a Stop Loss order at breakeven if the price has gone in the right direction for 15 pips. This will protect you from possible losses if the signal is false.
No significant events or reports are scheduled in the U.K. or the U.S. on Friday. Since the British pound has recently calmed down, we can likely expect low volatility today. However, the pair may still be inclined toward growth.
Illustration Explanations:
- Support and Resistance Levels (thick red lines): Thick red lines indicate where movement may come to an end. Please note that these lines are not sources of trading signals.
- Kijun-sen and Senkou Span B Lines: Ichimoku indicator lines transferred from the 4-hour timeframe to the hourly timeframe. These are strong lines.
- Extreme Levels (thin red lines): Thin red lines where the price has previously bounced. These serve as sources of trading signals.
- Yellow Lines: Trendlines, trend channels, or any other technical patterns.
- Indicator 1 on COT Charts: Represents the net position size for each category of traders.