Forecast for March 9:
Analytical review of currency pairs on the scale of H1:
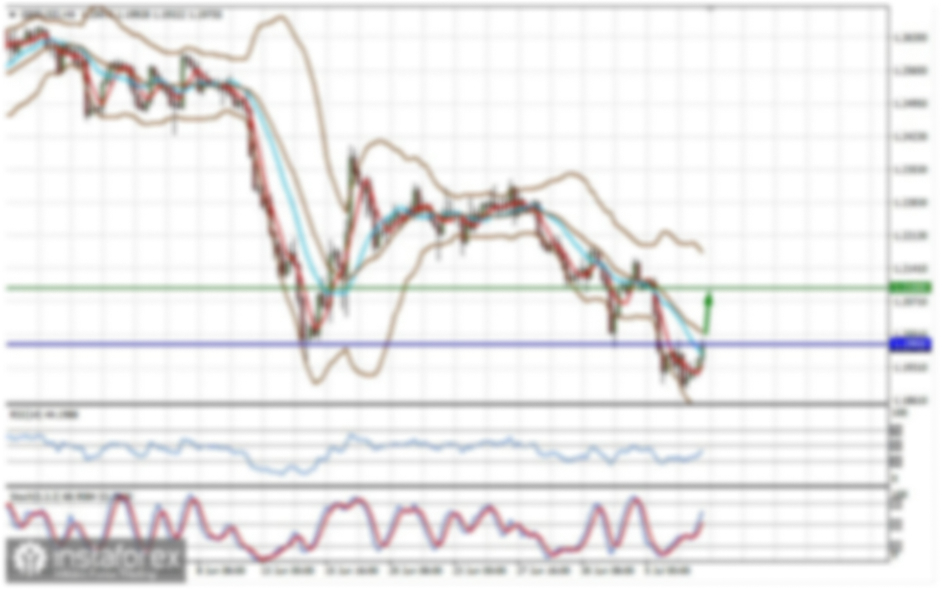
For the euro / dollar pair, the key levels on the H1 scale are: 1.1503, 1.1419, 1.1359, 1.1280, 1.1242, 1.1183 and 1.1122. Here, we are following the local upward cycle of February 28. Short-term upward movement is expected in the range of 1.1359 - 1.1419. The breakdown of the last value will lead to a pronounced movement. Here, the target is 1.1503. We expect a pullback to the bottom from this level.
Short-term downward movement is expected in the range of 1.1280 - 1.1242. The breakdown of the last value will lead to an in-depth correction. Here, the goal is 1.1183. This level is a key support for the top. Its passage at the price will lead to the formation of initial conditions for the downward cycle. In this case, the goal is 1.1122.
The main trend is the local upward cycle of February 28
Trading recommendations:
Buy: 1.1360 Take profit: 1.1417
Buy: 1.1421 Take profit: 1.1503
Sell: 1.1280 Take profit: 1.1243
Sell: 1.1241 Take profit: 1.1184
For the pound / dollar pair, the key levels on the H1 scale are: 1.3195, 1.3154, 1.3113, 1.3055, 1.3026 and 1.2981. Here, we are following the development of the ascending structure of February 28. The continuation of the movement to the top is expected after the breakdown of the level of 1.3113. In this case, the target is 1.3154. Price consolidation is near this level. For the potential value for the top, we consider the level of 1.3195. Upon reaching which, we expect a pullback to the bottom.
Short-term downward movement is possibly in the range of 1.3055 - 1.3026. The breakdown of the last value will lead to an in-depth correction. Here, the target is 1.2981. This level is a key support for the top.
The main trend is the upward cycle of February 28.
Trading recommendations:
Buy: 1.3113 Take profit: 1.3152
Buy: 1.3155 Take profit: 1.3193
Sell: 1.3055 Take profit: 1.3027
Sell: 1.3024 Take profit: 1.2981
For the dollar / franc pair, the key levels on the H1 scale are: 0.9423, 0.9372, 0.9330, 0.9266, 0.9211, 0.9178 and 0.9104. Here, we are following the local descending structure of March 4. The continuation of movement to the bottom is expected after the breakdown of the level of 0.9266. In this case, the target is 0.9211. Price consolidation is in the range of 0.9211 - 0.9178. For the potential value for the bottom, we consider the level of 0.9104. Upon reaching this level, we expect a pullback to the top.
Short-term upward movement is possibly in the range of 0.9330 - 0.9372. The breakdown of the latter value will lead to an in-depth correction. Here, the target is 0.9423. This level is a key support for the downward structure.
The main trend is the local descending structure of March 4
Trading recommendations:
Buy : 0.9330 Take profit: 0.9371
Buy : 0.9373 Take profit: 0.9421
Sell: 0.9264 Take profit: 0.9211
Sell: 0.9177 Take profit: 0.9105
For the dollar / yen pair, the key levels on the scale are : 105.73, 104.96, 104.45, 103.20, 102.55 and 101.90. Here, we are following the development of the local descending structure of March 3. Short-term downward movement is expected in the range of 103.20 - 102.55. Hence, the high probability of a reversal to the top. The breakdown of the level of 102.55 will allow you to count on movement to a potential target of 101.90.
Short-term upward movement is possibly in the range of 104.45 - 104.96. The breakdown of the latter value will lead to an in-depth correction. In this case, the target is 105.73. This level is a key support for the downward structure.
Main trend: local descending structure of March 3
Trading recommendations:
Buy: 104.45 Take profit: 104.95
Buy : 104.98 Take profit: 105.73
Sell: 103.20 Take profit: 102.57
Sell: 102.53 Take profit: 101.90
For the Canadian dollar / US dollar pair, the key levels on the H1 scale are: 1.3643, 1.3578, 1.3545, 1.3509 and 1.3438. Here, we are following the ascendant structure of March 3. At the moment, we expect a significant rollback to the correction. A short-term downward movement is possibly in the range of 1.3578 - 1.3545. The breakdown of the last value will lead to an in-depth correction. Here, the target is 1.3509. This level is a key support for the correction zone. Its passage through the price will lead to a pronounced downward movement. Here, the potential target is 1.3438.
For an upward movement, the breakdown of the level of 1.3643 should be accompanied by an unstable development of the trend until we consider further goals.
The main trend is the upward structure of March 3
Trading recommendations:
Buy: Take profit:
Buy : Take profit:
Sell: 1.3578 Take profit: 1.3545
Sell: 1.3543 Take profit: 1.3510
For the Australian dollar / US dollar pair, the key levels on the H1 scale are : 0.6728, 0.6701, 0.6667, 0.6649, 0.6623, 0.6602 and 0.6574. Here, we are following the development of the upward cycle of February 28. Short-term upward movement is expected in the range of 0.6649 - 0.6667. The breakdown of the latter value will lead to a pronounced movement. Here, the target is 0.6701. Price consolidation is near this level. For the potential value for the top, we consider the level of 0.6728. Upon reaching which, we expect a pullback to the bottom.
Consolidated movement is possibly in the range of 0.6623 - 0.6602. The breakdown of the last value will lead to an in-depth correction. Here, the target is 0.6574. This level is a key support for the top.
The main trend is the upward cycle of February 28
Trading recommendations:
Buy: 0.6650 Take profit: 0.6665
Buy: 0.6668 Take profit: 0.6701
Sell : 0.6623 Take profit : 0.6604
Sell: 0.6601 Take profit: 0.6576
For the euro / yen pair, the key levels on the H1 scale are: 119.60, 119.31, 118.87, 118.51, 117.90, 117.37, 117.01 and 116.35. Here, we are following the descending structure of March 3. The continuation of the movement to the bottom is expected after the breakdown of the level of 117.90. In this case, the target is 117.37. Price consolidation is in the range of 117.37 - 117.01. For the potential value for the bottom, we consider the level of 116.35. Upon reaching which, we expect a pullback to the top.
Short-term upward movement is possibly in the range of 118.51 - 118.87. The breakdown of the last value will lead to an in-depth correction. Here, the target is 119.31. The range of 119.31 - 119.60 is a key support for the downward structure. We expect the initial conditions for the upward cycle to be formed before it.
The main trend is the descending structure of March 3
Trading recommendations:
Buy: 118.51 Take profit: 118.87
Buy: 118.88 Take profit: 119.30
Sell: 117.90 Take profit: 117.38
Sell: 117.35 Take profit: 117.02
For the pound / yen pair, the key levels on the H1 scale are : 137.28, 136.70, 136.31, 135.55, 135.01, 134.28 and 133.82. Here, we are following the local descending structure of March 2. The continuation of movement to the bottom is expected after the breakdown of the level of 135.55. Here, the goal is 135.01. Price consolidation is near this level. The breakdown of the level of 135.00 will lead to a pronounced downward movement. Here, the goal is 134.28. For the potential value for the bottom, we consider the level of 133.82. Upon reaching which, we expect consolidation, as well as a rollback to the top.
Short-term upward movement is possibly in the range of 136.31 - 136.70. The breakdown of the latter value will lead to the development of an in-depth correction. Here, the goal is 137.28. This level is a key support for the downward cycle.
The main trend is the local descending structure of March 2
Trading recommendations:
Buy: 136.31 Take profit: 136.70
Buy: 136.72 Take profit: 137.28
Sell: 135.55 Take profit: 135.01
Sell: 134.98 Take profit: 134.30