signal strength 1 of 5
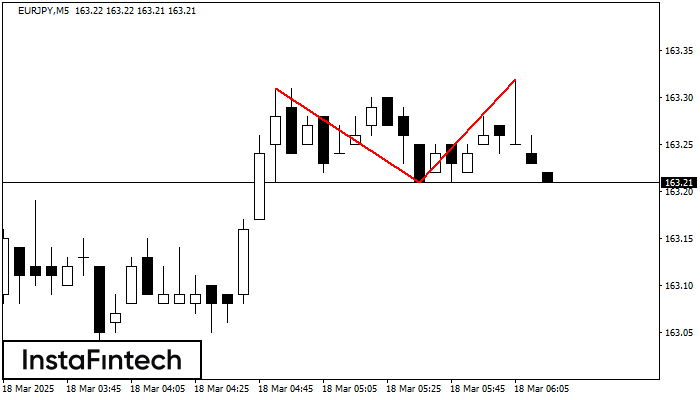
The Double Top pattern has been formed on EURJPY M5. It signals that the trend has been changed from upwards to downwards. Probably, if the base of the pattern 163.21 is broken, the downward movement will continue.
The M5 and M15 time frames may have more false entry points.
আরও দেখুন
- All
- Double Top
- Flag
- Head and Shoulders
- Pennant
- Rectangle
- Triangle
- Triple top
- All
- #AAPL
- #AMZN
- #Bitcoin
- #EBAY
- #FB
- #GOOG
- #INTC
- #KO
- #MA
- #MCD
- #MSFT
- #NTDOY
- #PEP
- #TSLA
- #TWTR
- AUDCAD
- AUDCHF
- AUDJPY
- AUDUSD
- EURCAD
- EURCHF
- EURGBP
- EURJPY
- EURNZD
- EURRUB
- EURUSD
- GBPAUD
- GBPCHF
- GBPJPY
- GBPUSD
- GOLD
- NZDCAD
- NZDCHF
- NZDJPY
- NZDUSD
- SILVER
- USDCAD
- USDCHF
- USDJPY
- USDRUB
- All
- M5
- M15
- M30
- H1
- D1
- All
- Buy
- Sale
- All
- 1
- 2
- 3
- 4
- 5
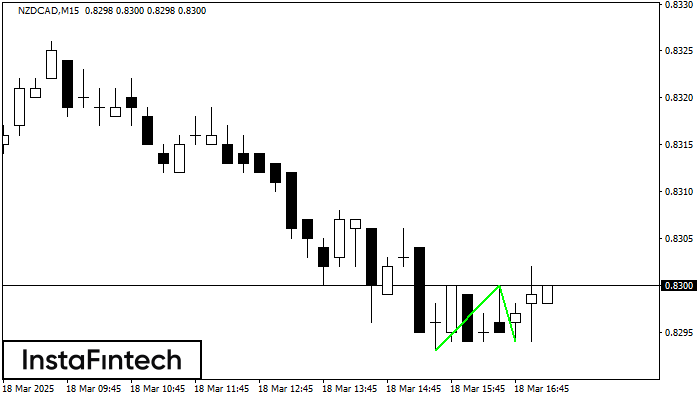
The Double Bottom pattern has been formed on NZDCAD M15; the upper boundary is 0.8300; the lower boundary is 0.8294. The width of the pattern is 7 points. In case
The M5 and M15 time frames may have more false entry points.
Open chart in a new window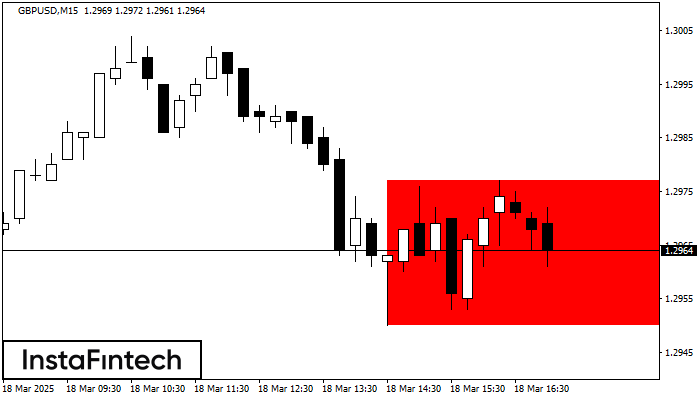
According to the chart of M15, GBPUSD formed the Bearish Rectangle which is a pattern of a trend continuation. The pattern is contained within the following borders: lower border 1.2950
The M5 and M15 time frames may have more false entry points.
Open chart in a new window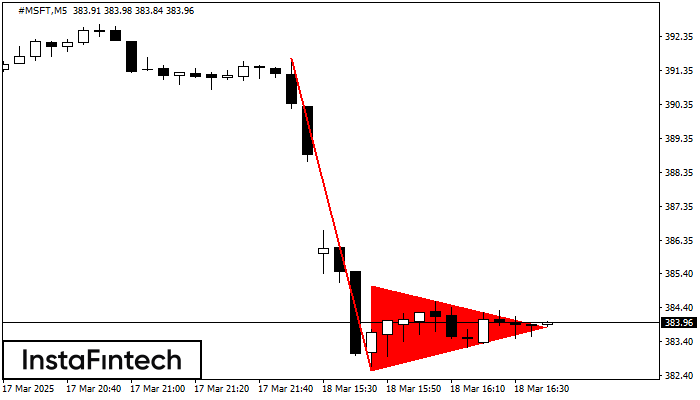
The Bearish pennant pattern has formed on the #MSFT M5 chart. It signals potential continuation of the existing trend. Specifications: the pattern’s bottom has the coordinate of 382.56; the projection
The M5 and M15 time frames may have more false entry points.
Open chart in a new window